 GR calculator
 GREIN
GREIN Signeta
Reversing MTOR loss-of-function signature profile
In the following example, we will start with a gene knockdown (loss-of-function) transcriptional signature and will try to identify a drug or sets of drugs that have opposite transcriptional signatures. For this example, we will look at MTOR gene knockdown in PC3, prostate cancer cells; will compare its transcriptional signature to the known MTOR inhibitor drug, Sirolimus (Rapamycin) signature and will identify highly disconnected (opposite) drug signatures to reverse its transcriptional signature.
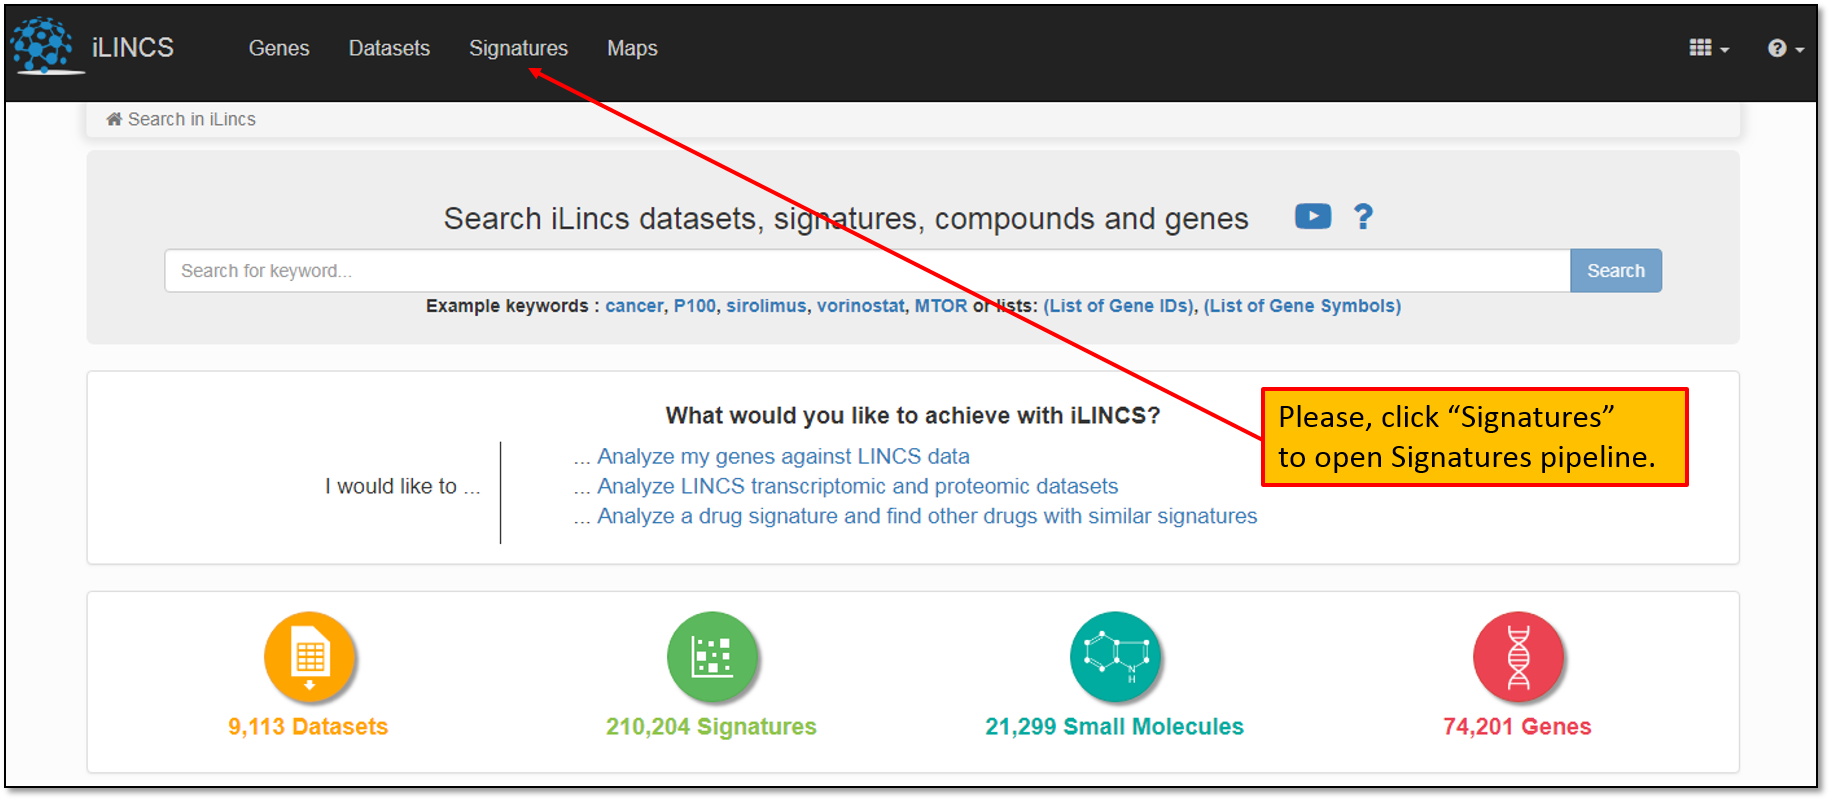
1. First, let's open Signatures Pipeline starting with the iLINCS homepage as shown below.
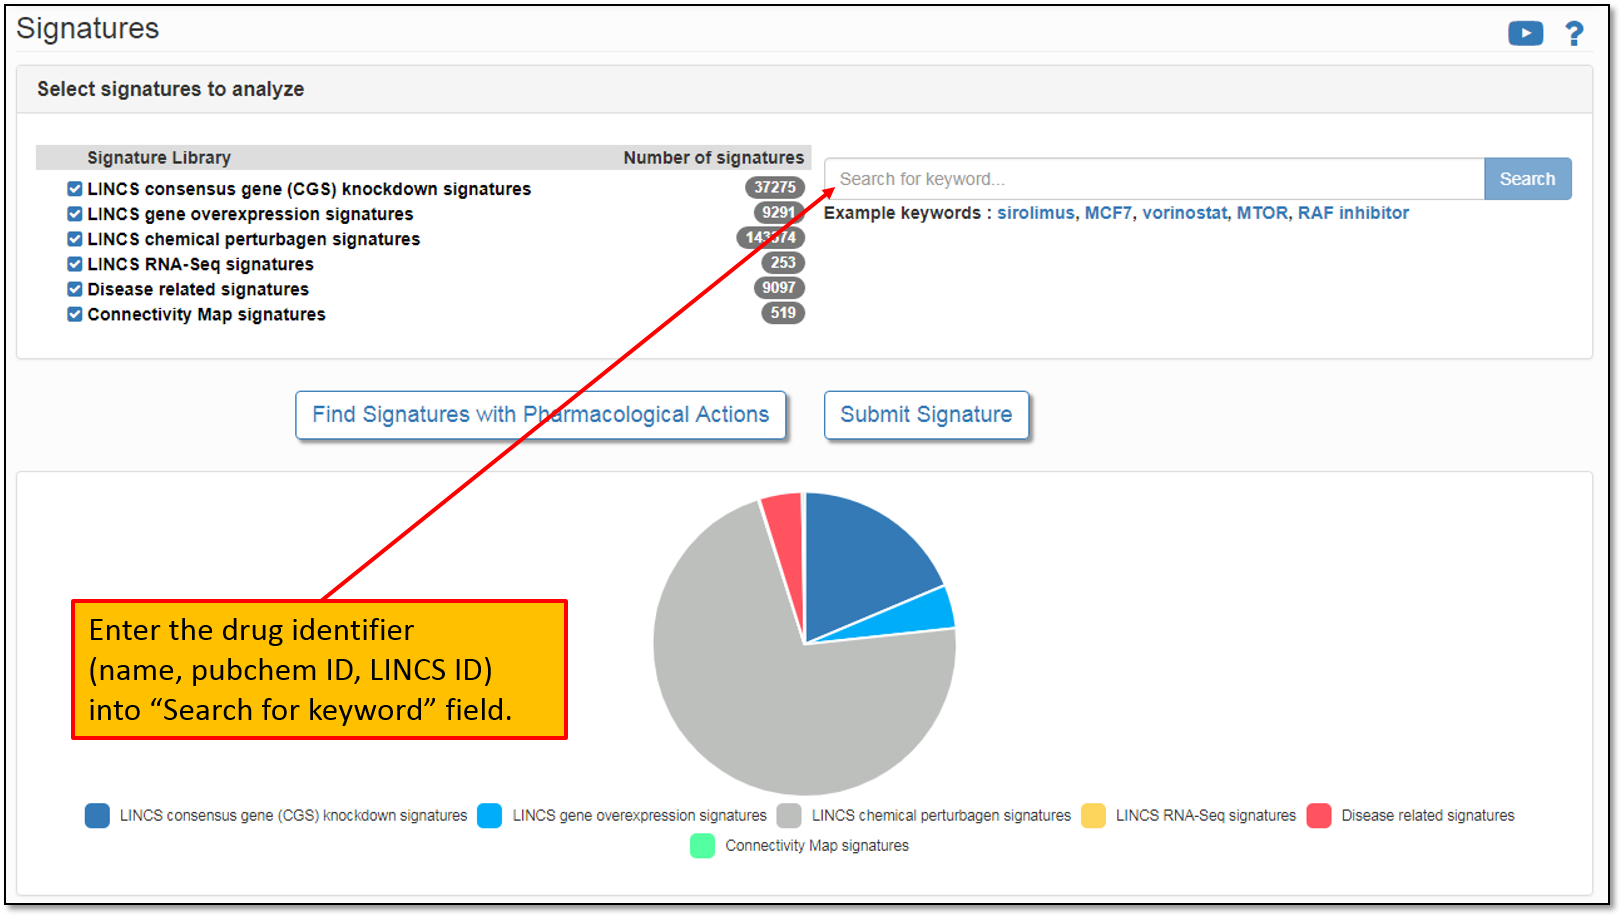
2. This will take you to a Signatures pipeline landing page that lists all pre-computed signatures available for the analysis. At the time of this writing, there were more than 200,000 pre-computed signatures listed on iLINCS. You may enter the drug identifier (name, pubchem ID, LINCS ID) or gene symbol into “Search for keyword" field as shown below.
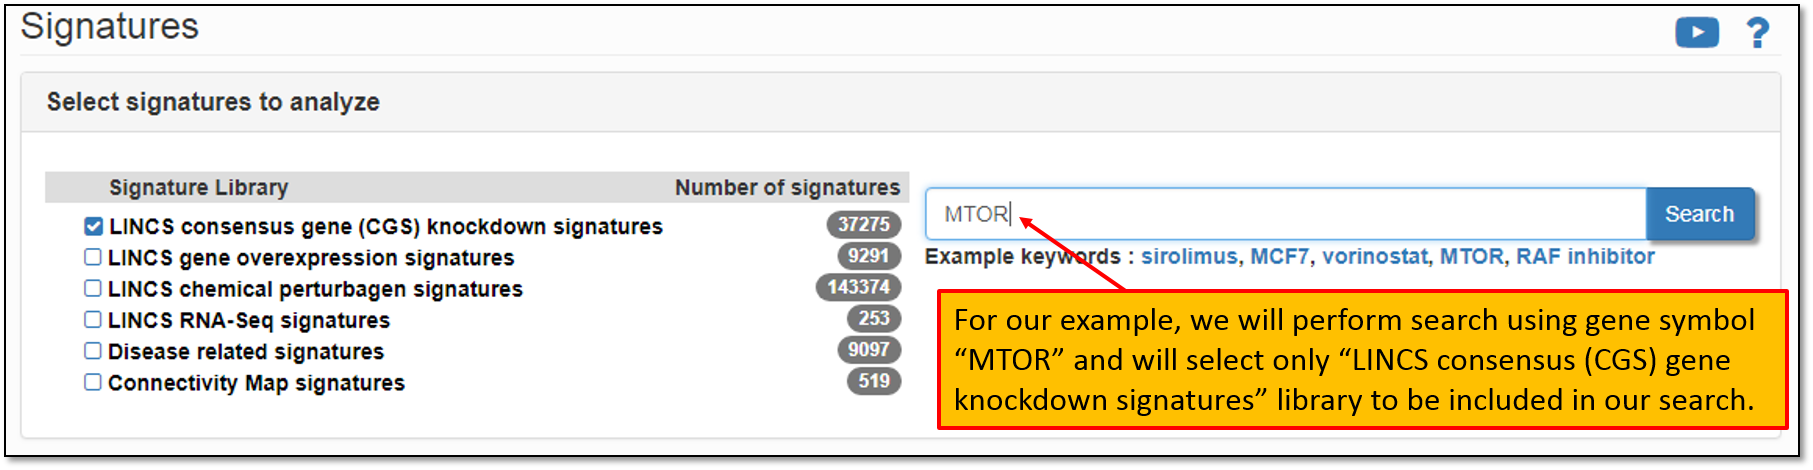
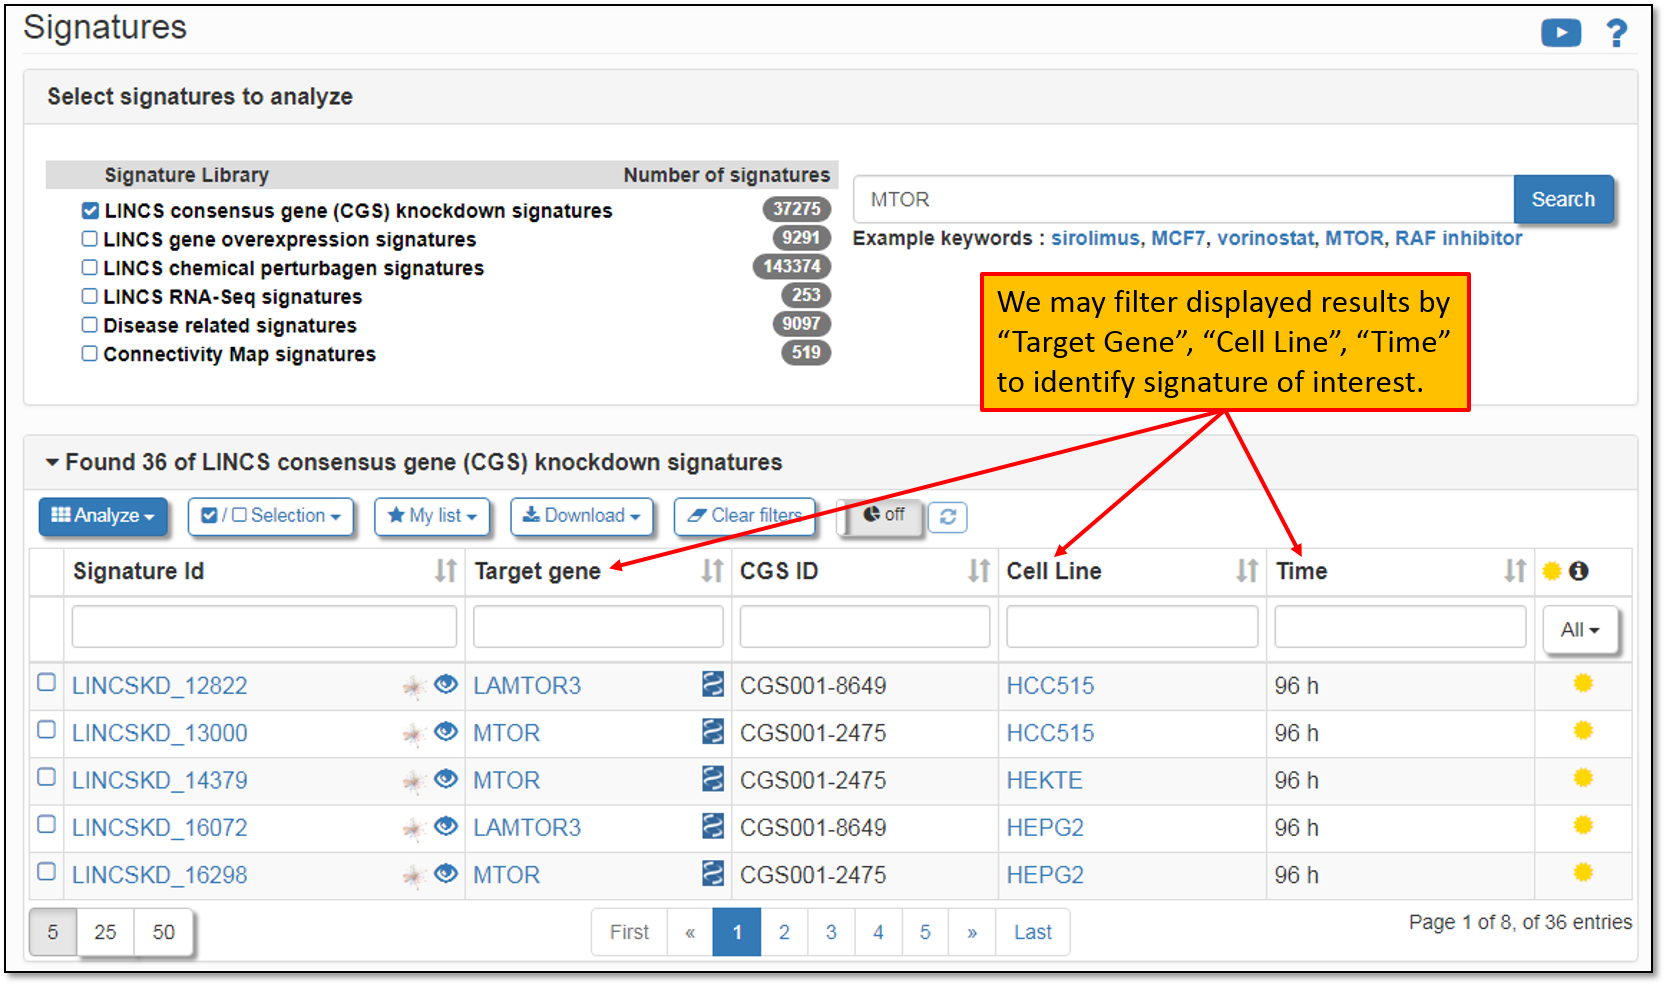
3. For our example, we are interested in identifying MTOR gene knockdown signature in PC3 cells. Keyword search is performed across all the signature libraries by default. First, we will select "LINCS consensus gene (CGS) knockdown signatures" library and then perform search by typing "MTOR" in a search field as shown in the figure below.
4. As seen in the figure below, searching for gene symbol "MTOR" in "LINCS consensus gene (CGS) knockdown signatures" library had found 36 matching precomputed signatures. To display found results, we must click on "Found 36 of LINCS consensus gene (CGS) knockdown signatures". To filter out displayed signatures, you may filter signatures by target gene, cell line and/or time.
5. To identify the signature of interest, MTOR gene knockdown in PC3 cells in our example, we have the option to filter out displayed results by typing "PC3" in "Cell Line" field as shown below.
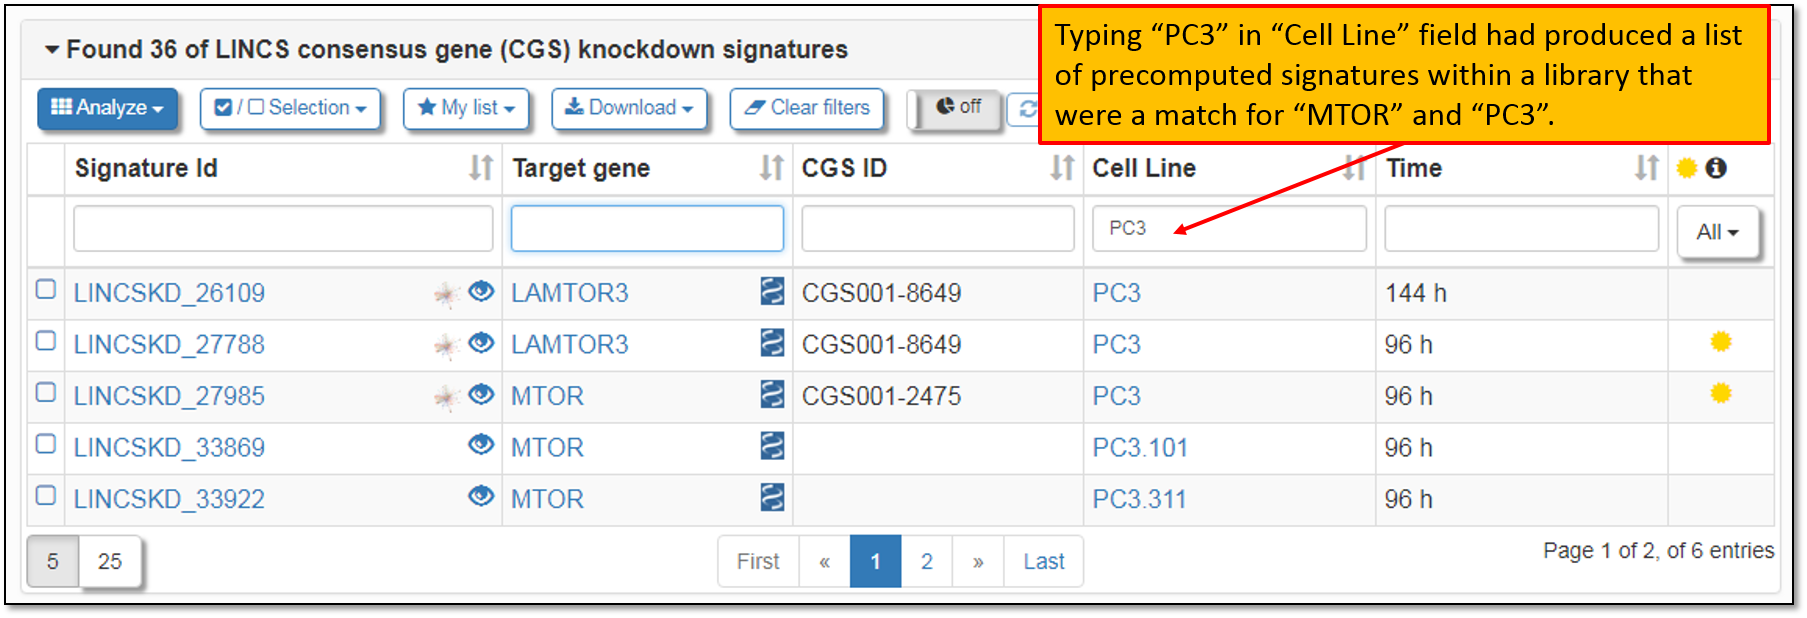
6. As seen in the figure above, and since iLINCS portal performs both complete and partial searches, we can see that searching for "MTOR" had also included gene "LAMTOR3" in the output results. For our example, let's choose signature "LINCSKD_27985", MTOR knockdown in PC3 cells. We may click on the signature ID to open the signature landing page as shown below. The signature landing page lists signature analysis results for top 100 differentially expressed genes within a signature (you may modify the number of the selected genes to be included in the analysis)
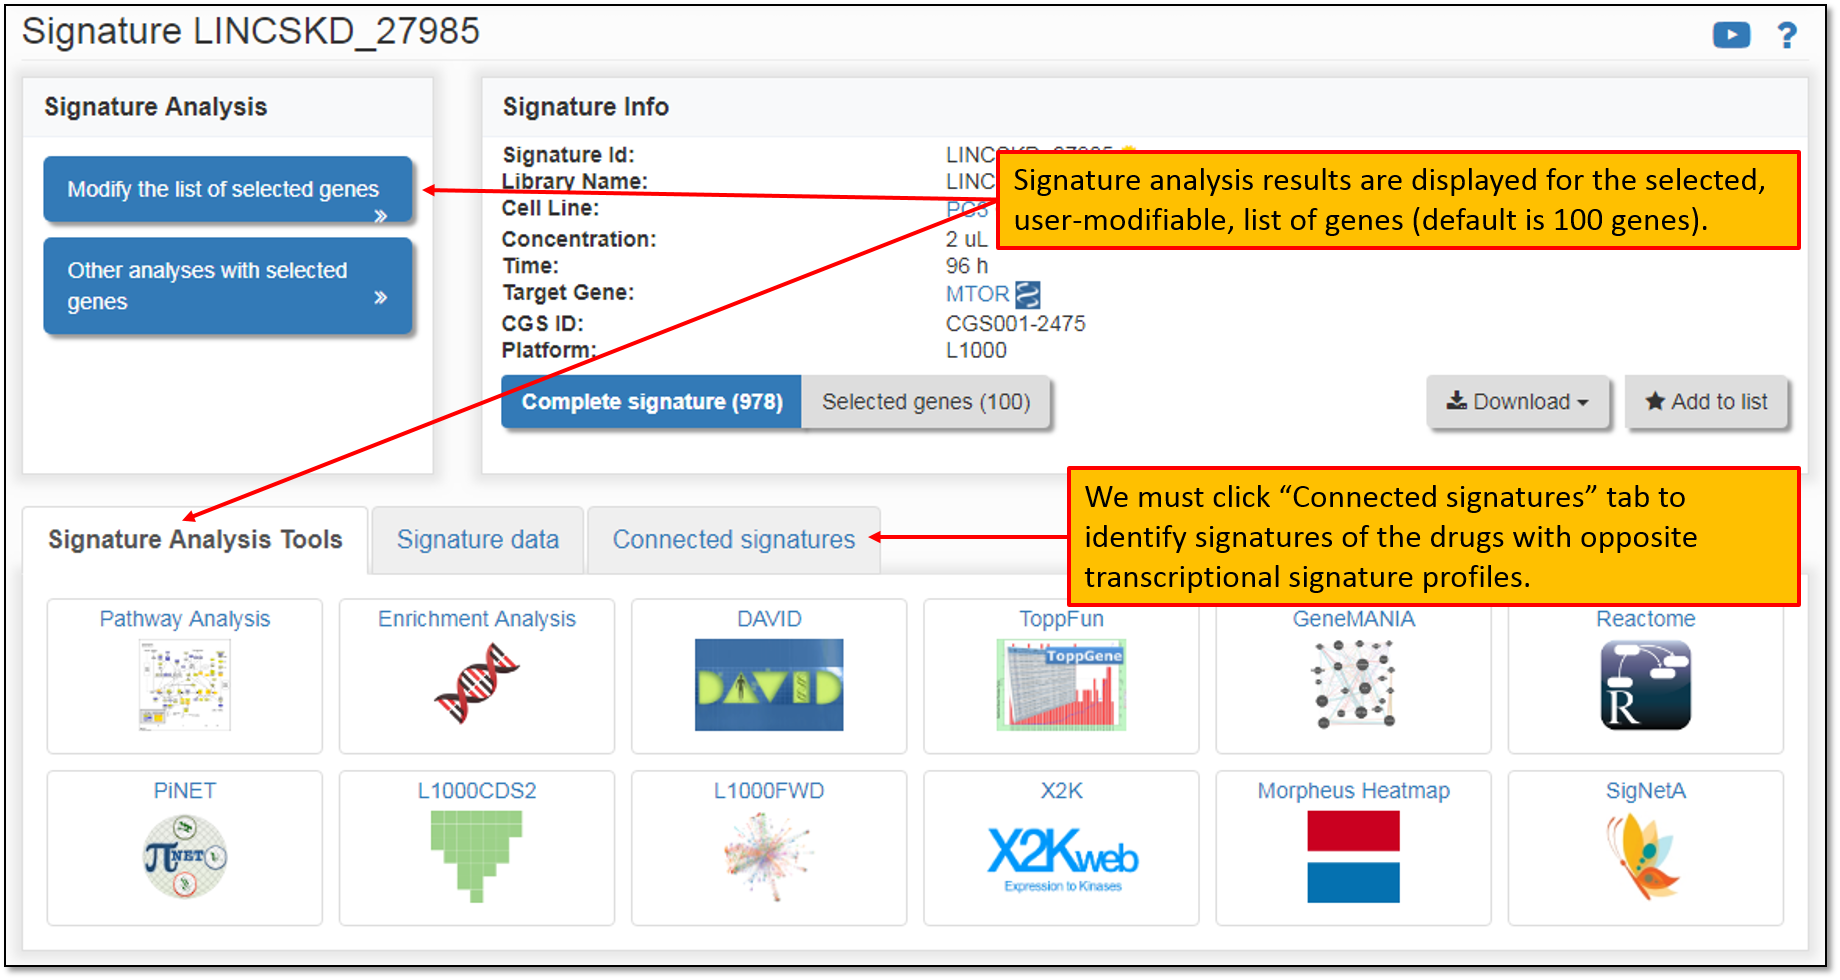
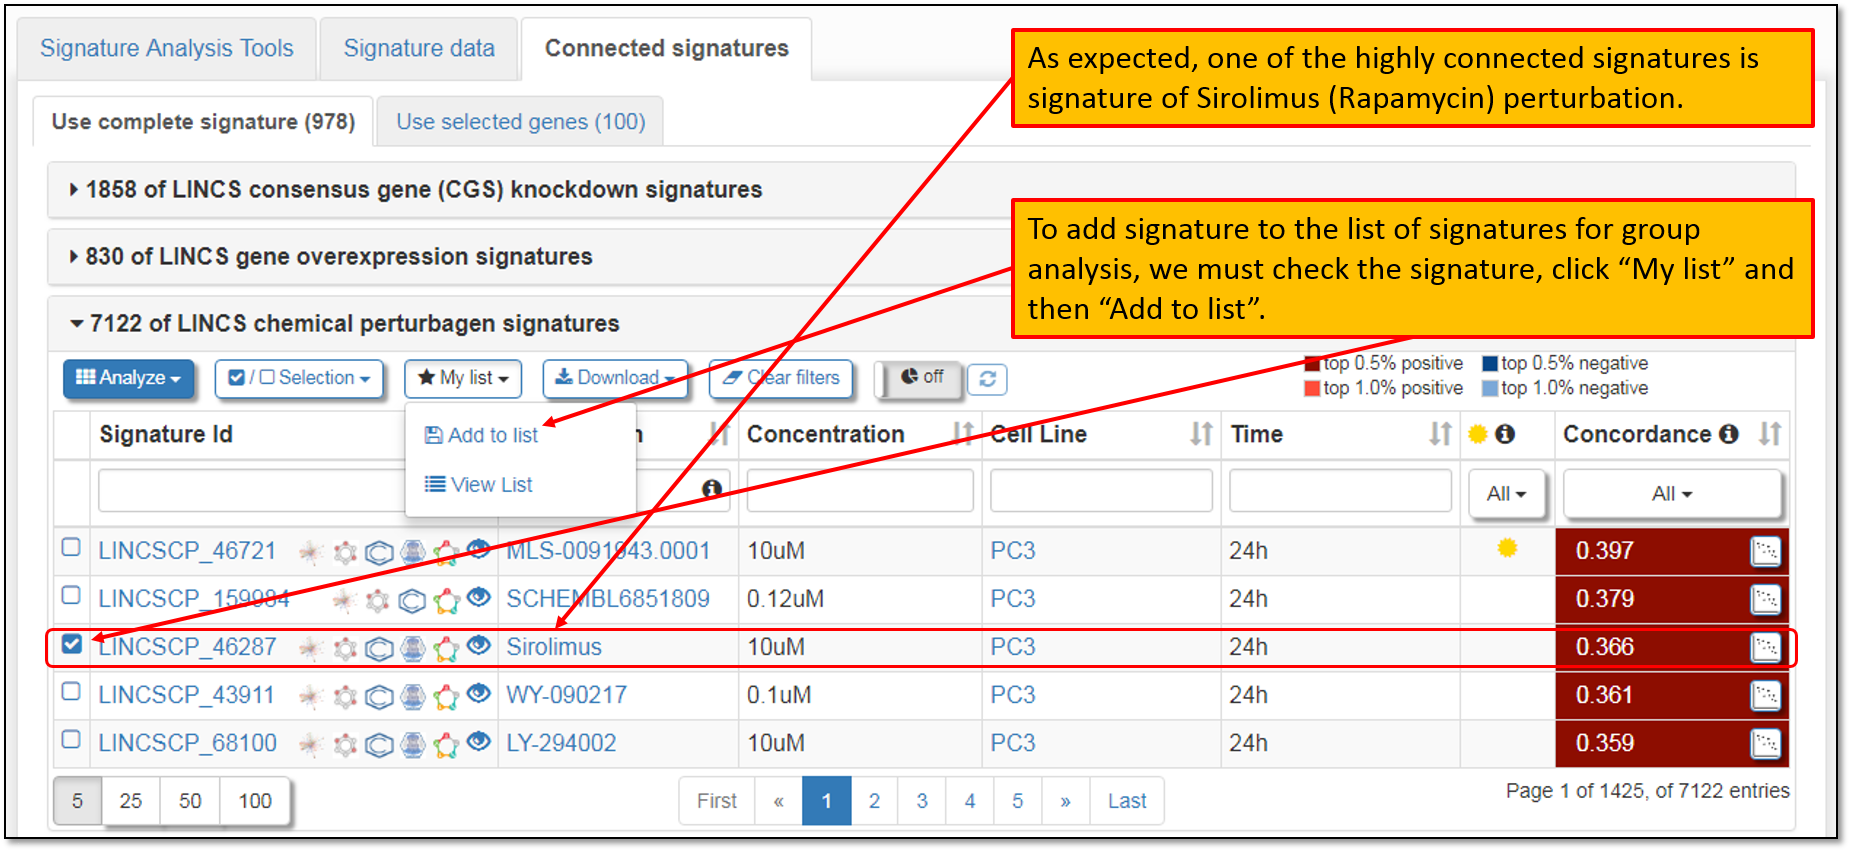
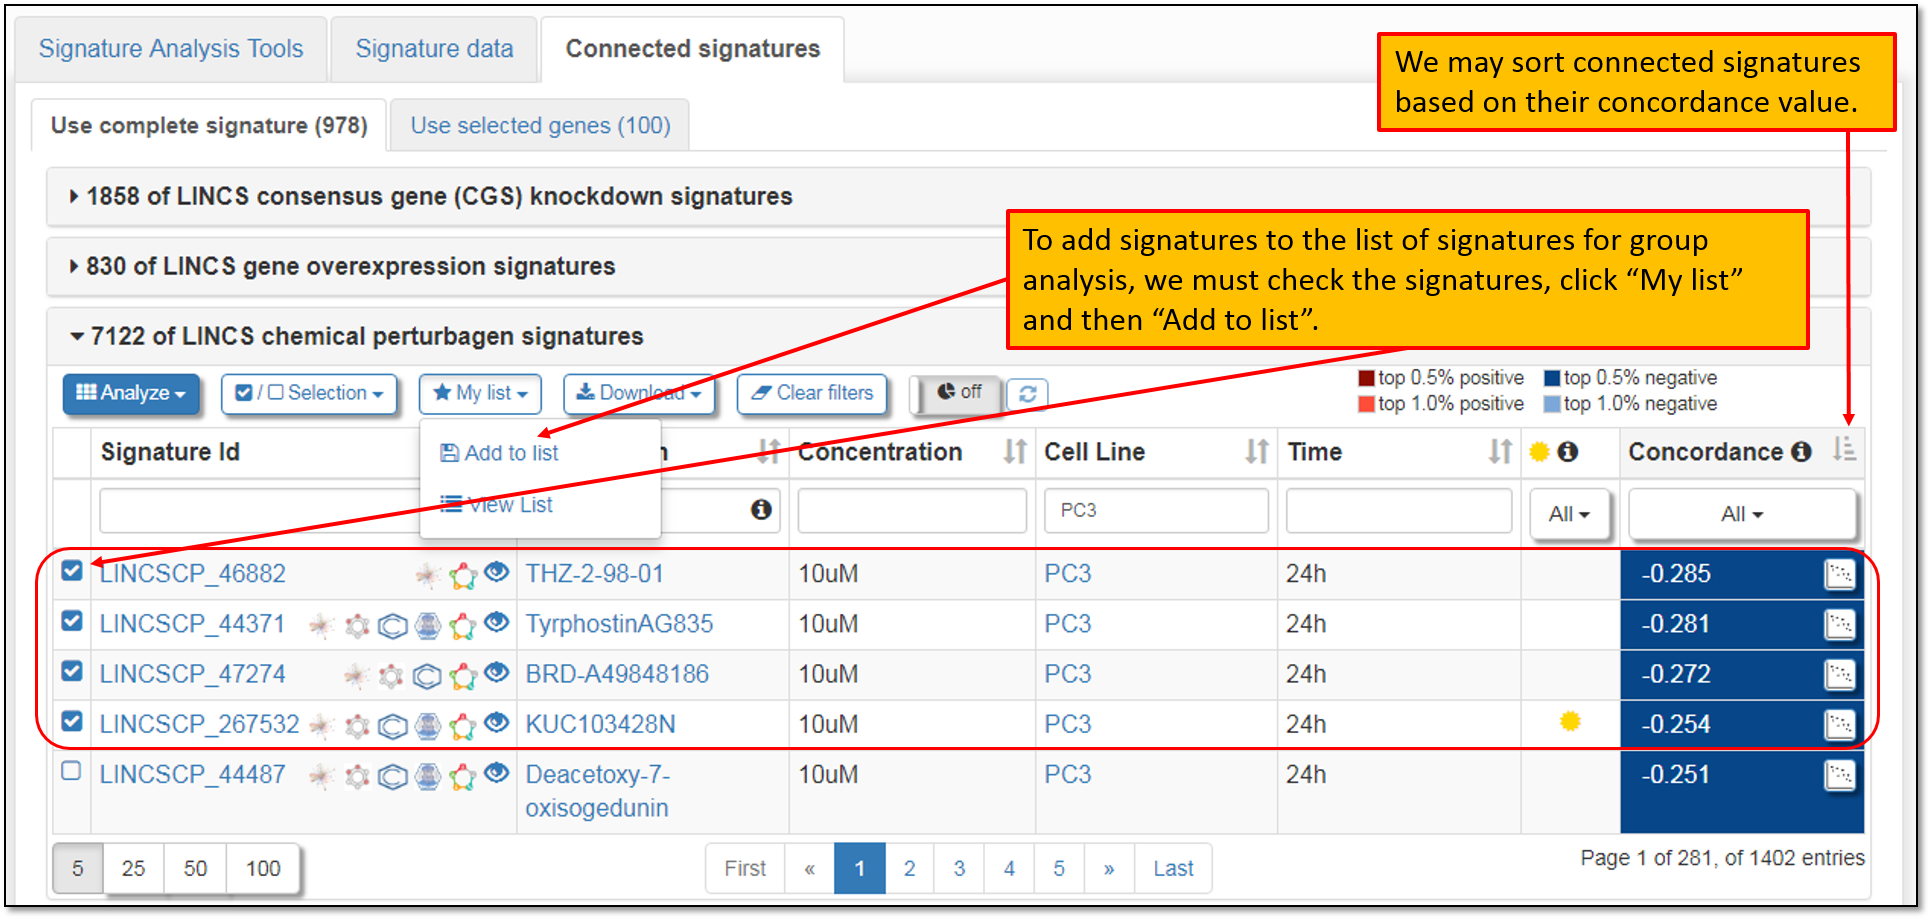
7. Clicking on the "Connected Signatures" tab will display connected (either with positive or negative concordance) signatures within all of the precomputed signature libraries in iLINCS portal as shown in the figure below. iLINCS uses a complete signature by default in displaying precomputed connected signatures, but you may instruct iLINCS to use only a subset of the signature (select genes only). We are going to use a complete signature (trancsriptional signature profile for all genes within a signature) since we are interested in identifying connected signatures of the drug perturbations that have most opposite transcriptional signature profile. As seen in the figure below and as expected, one of the highly concordant (similar) signatures is transcriptional signature of Sirolimus (Rapamycin) perturbation. Note that concordance value is not the top value for these two signatures since gene knockdown as well as chemical perturbation signatures include only select 978 genes (L1000) which may not reflect MTOR pathway in its entirety. Nevertheless, we will include Sirolimus signature in our analysis for comparison purposes (positive control). To do this, we must check the box next to the Sirolimus signature and then add it to the list of the signatures for the group analysis ("My list" > "Add to list").
8. We are interested in identifying signatures of drug perturbations that have most opposite transcriptional signature profile to MTOR knockdown in PC3 cells. As seen in the figure below, we may sort connected signatures based on their concordance value. Clicking two arrows next to "Concordance" will sort connected signatures in either increasing or decreasing concordance value. As before, to filter the connected signatures for specific cell line, we will type "PC3" in the "Cell Line" field.
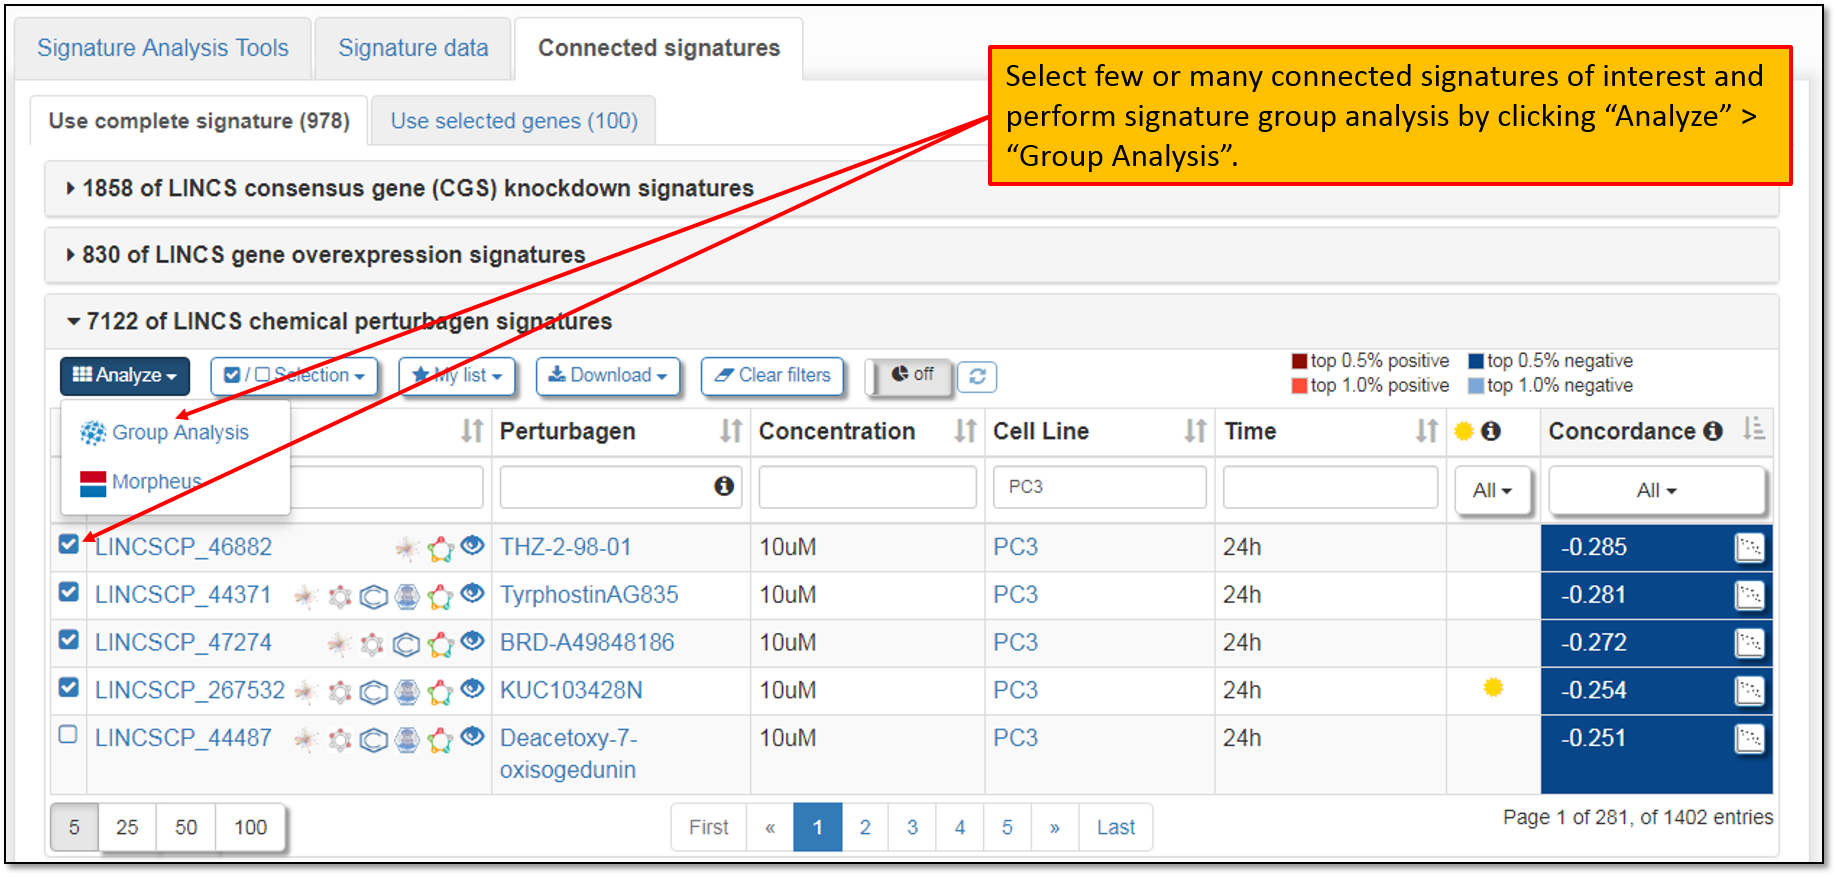
9. After selecting signatures of interest, we may perform signature group analysis to compare the transcriptional signatures of MTOR gene knockdown and selected negatively connected drug perturbation signatures. To do this, we must click blue "Analyze" button and then select "Group Analysis" option (see figure below).
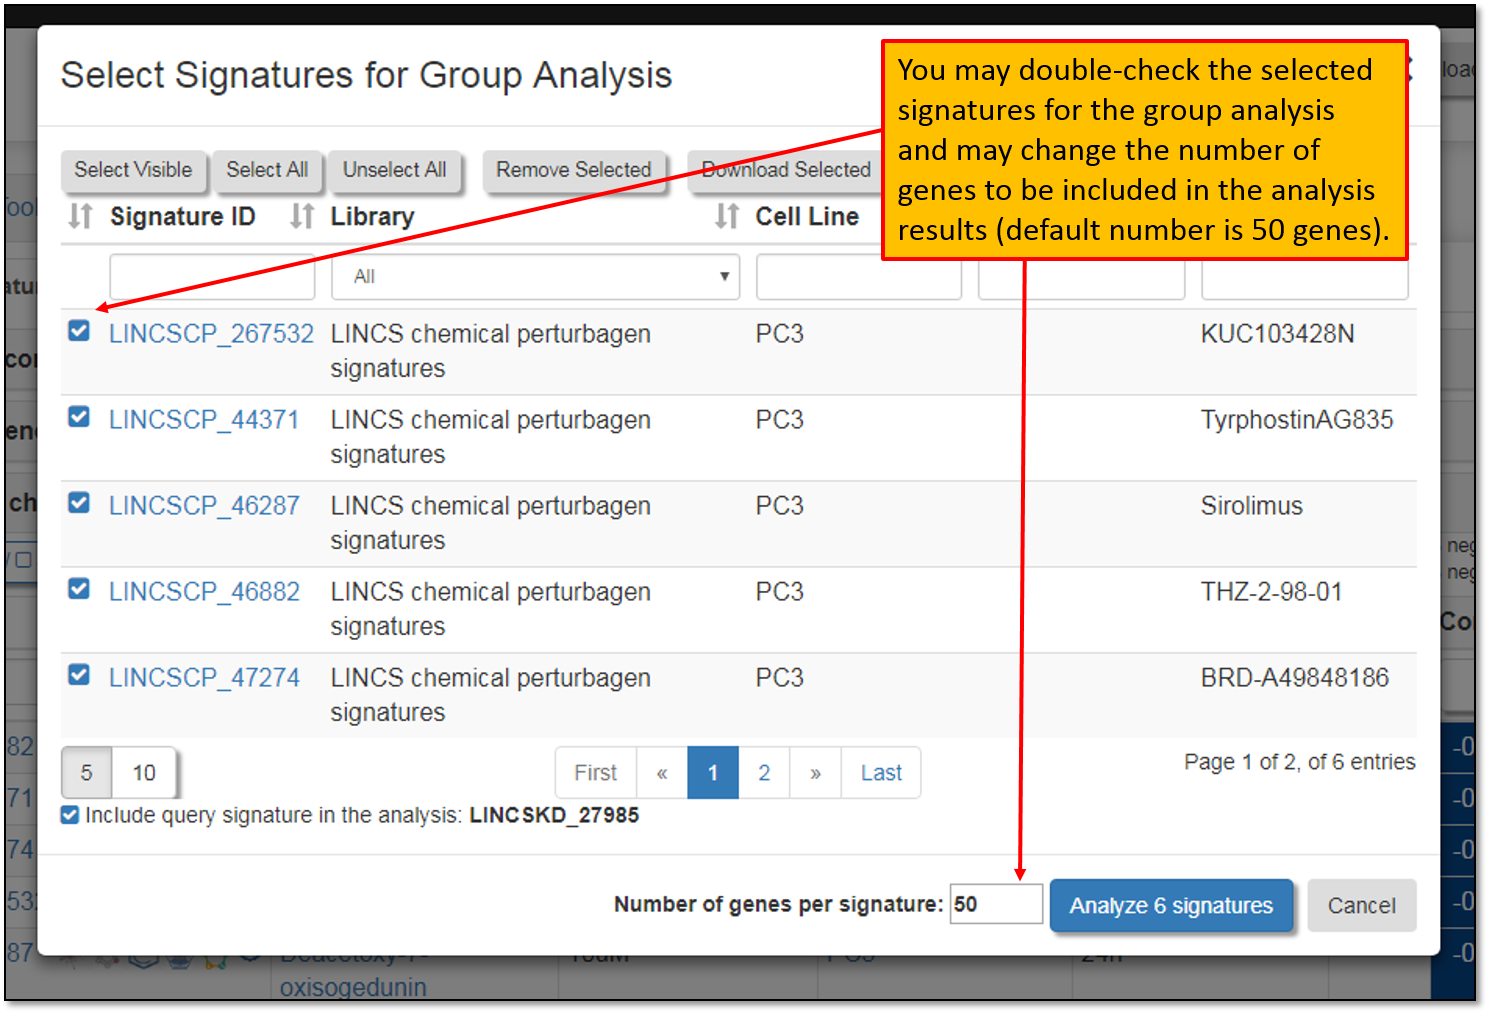
10. Clicking "Group Analysis" will prompt for your signature selection verification as seen in the figure below. Selected signatures from your previous analyses will stay in your browsing history, unless you clear your browser cache. Moreover, default number of top differentially expressed genes to be included in the signature group analysis is 50 genes per signature, but you may change this number as needed. After verifying your signature selections, we must click "Analyze 6 signatures" to perform signature group analysis.
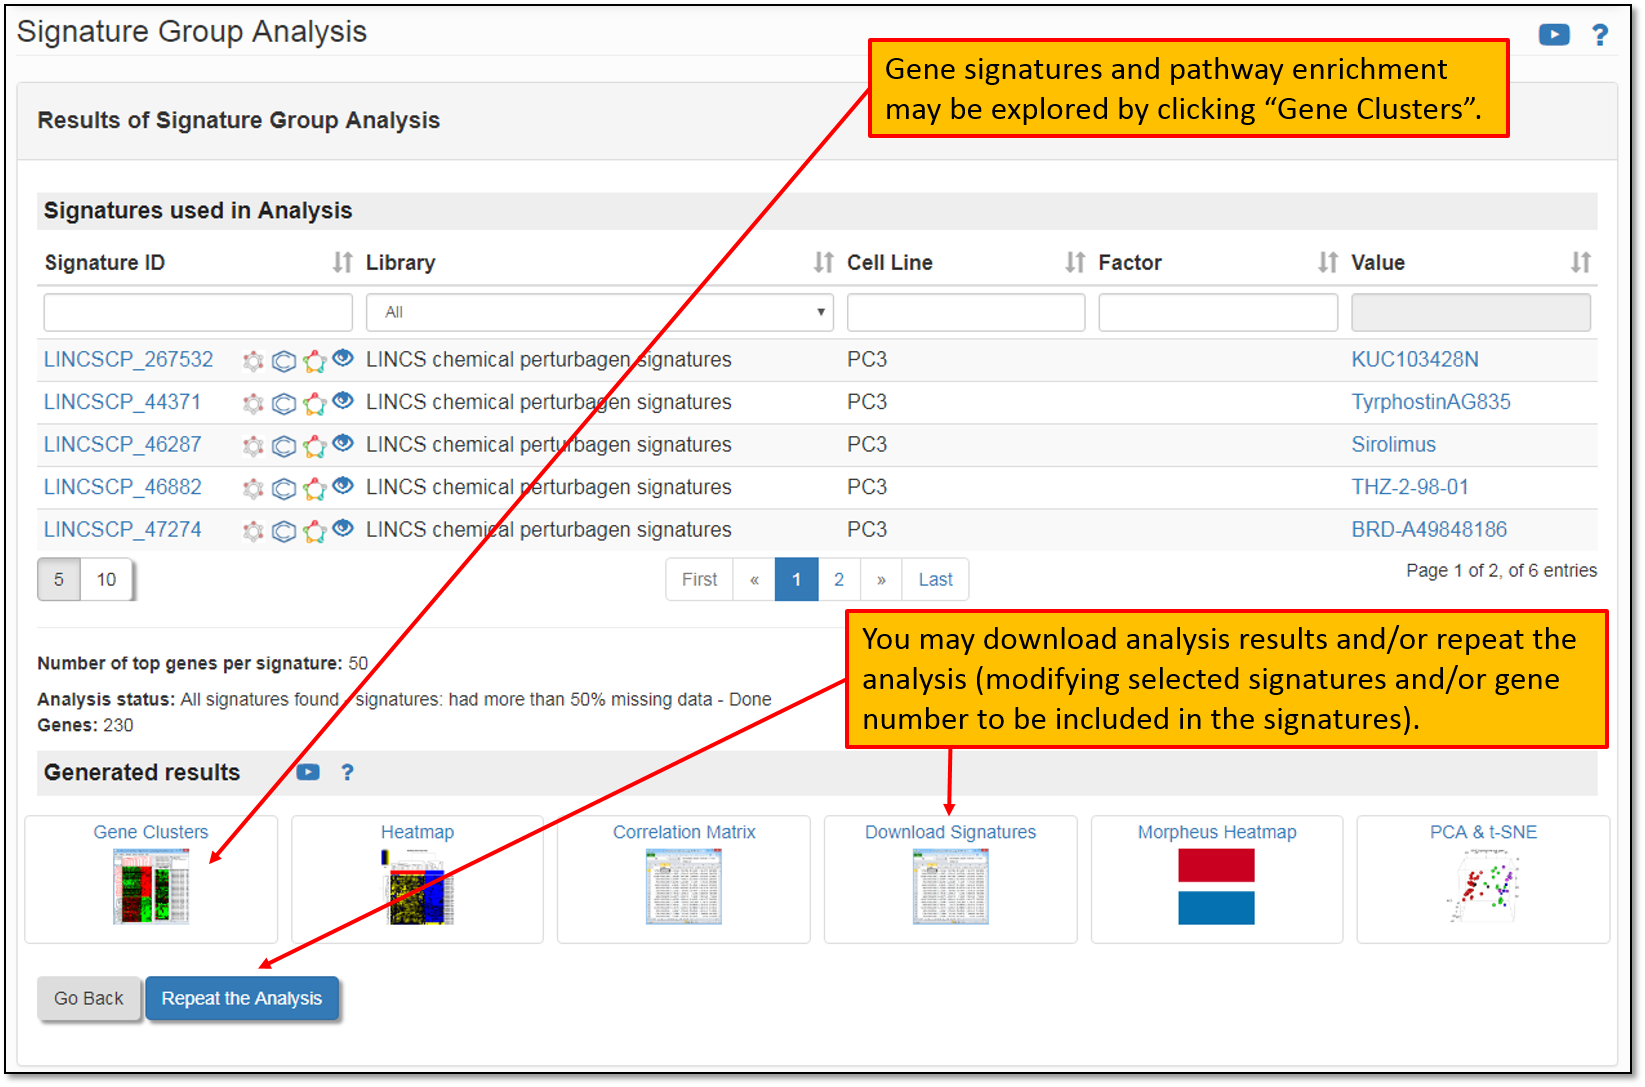
11. Clicking "Analyze 6 signatures", will perform signature group analysis and will display analysis results page for the signatures that we have selected earlier. Gene signatures and pathway enrichment can be explored by clicking "Gene Clusters". You may also download results for further analysis, and repeat the analysis by modifying selected signatures and/or gene number per signature to be included in the signature group analysis.
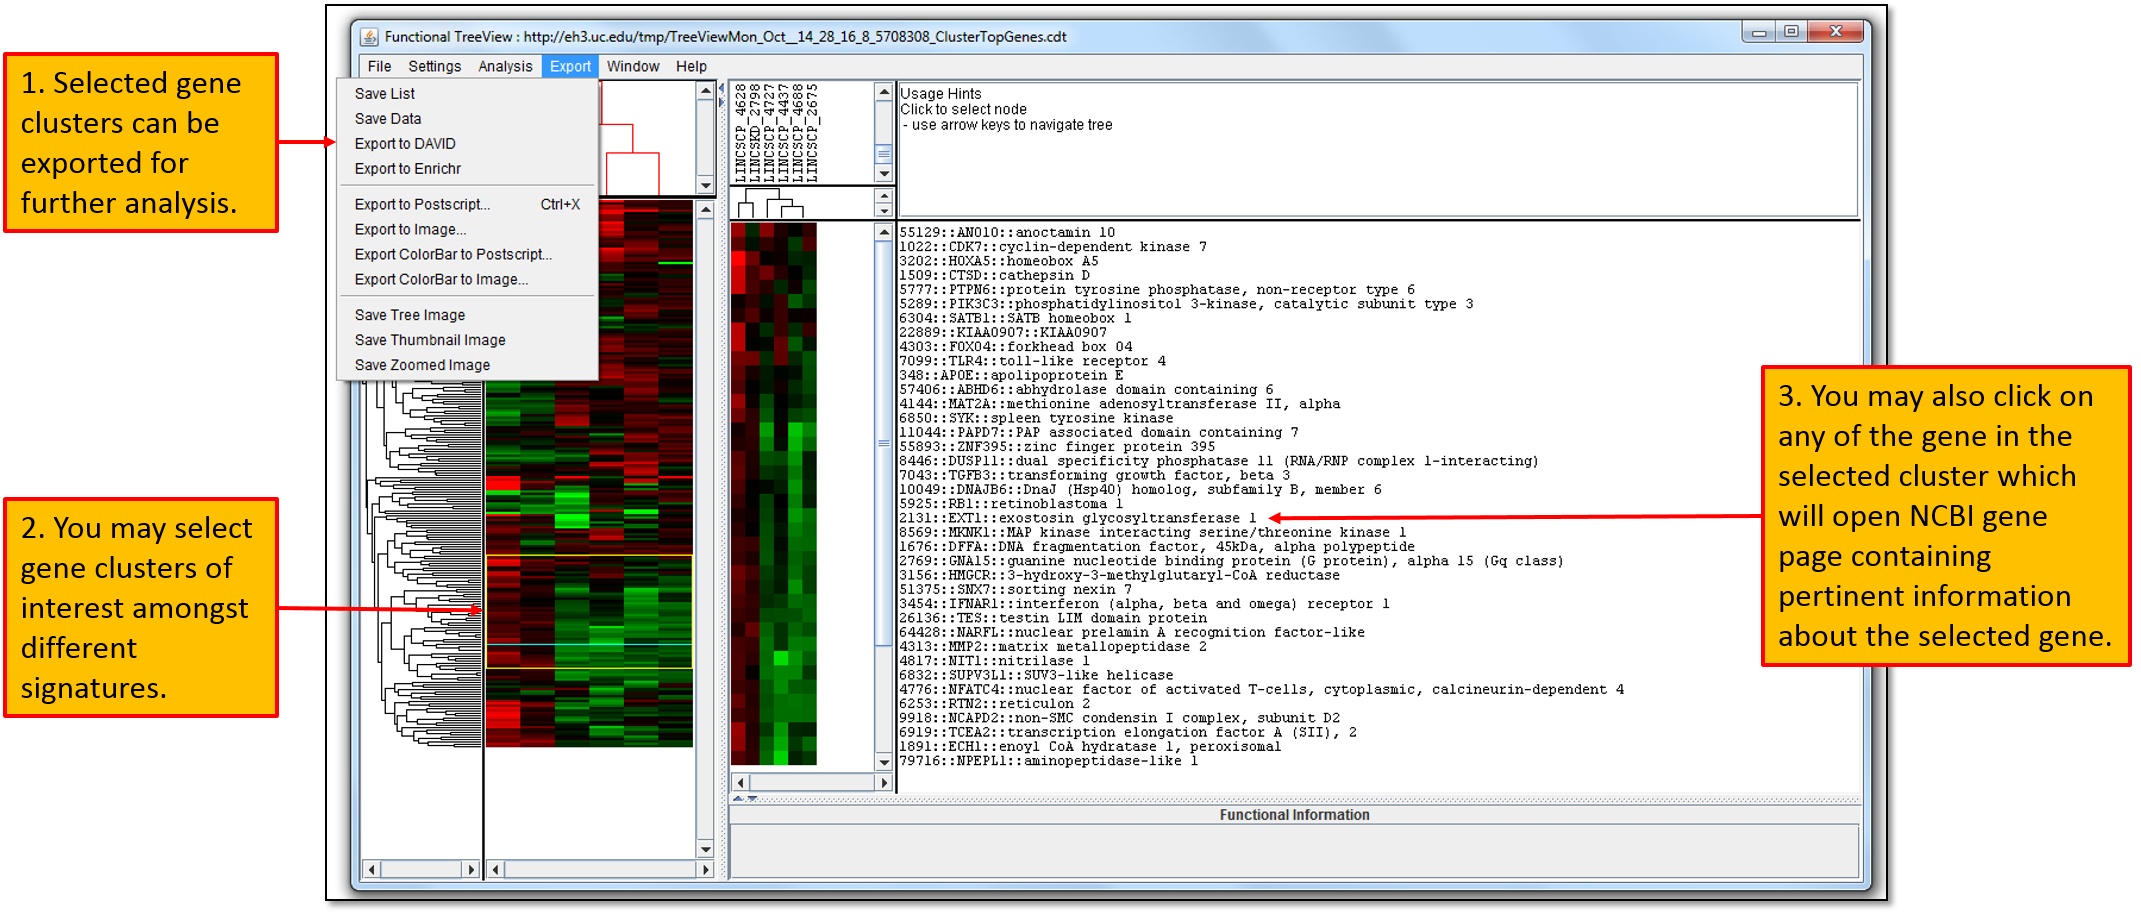
12. Clicking "Gene Clusters" will download a Functional Treeview analysis java file which will allow you to visualize similarly expressed gene clusters amongst selected signatures as shown in the figure below. Moreover, you may select gene clusters of interest, view genes in the cluster (you can also click on any of the gene in the cluster which will redirect to NCBI gene page specific to the selected gene) and you may also export selected genes in the cluster for further analysis.