 GR calculator
 GREIN
GREIN Signeta
Identify sets of drugs with similar transcriptional signatures
In the following work-flow example, we will start with a prototypical drug and will identify sets of drugs that have similar transcriptional signatures. Moreover, we will also pinpoint genes and pathways that are affected by the drug.
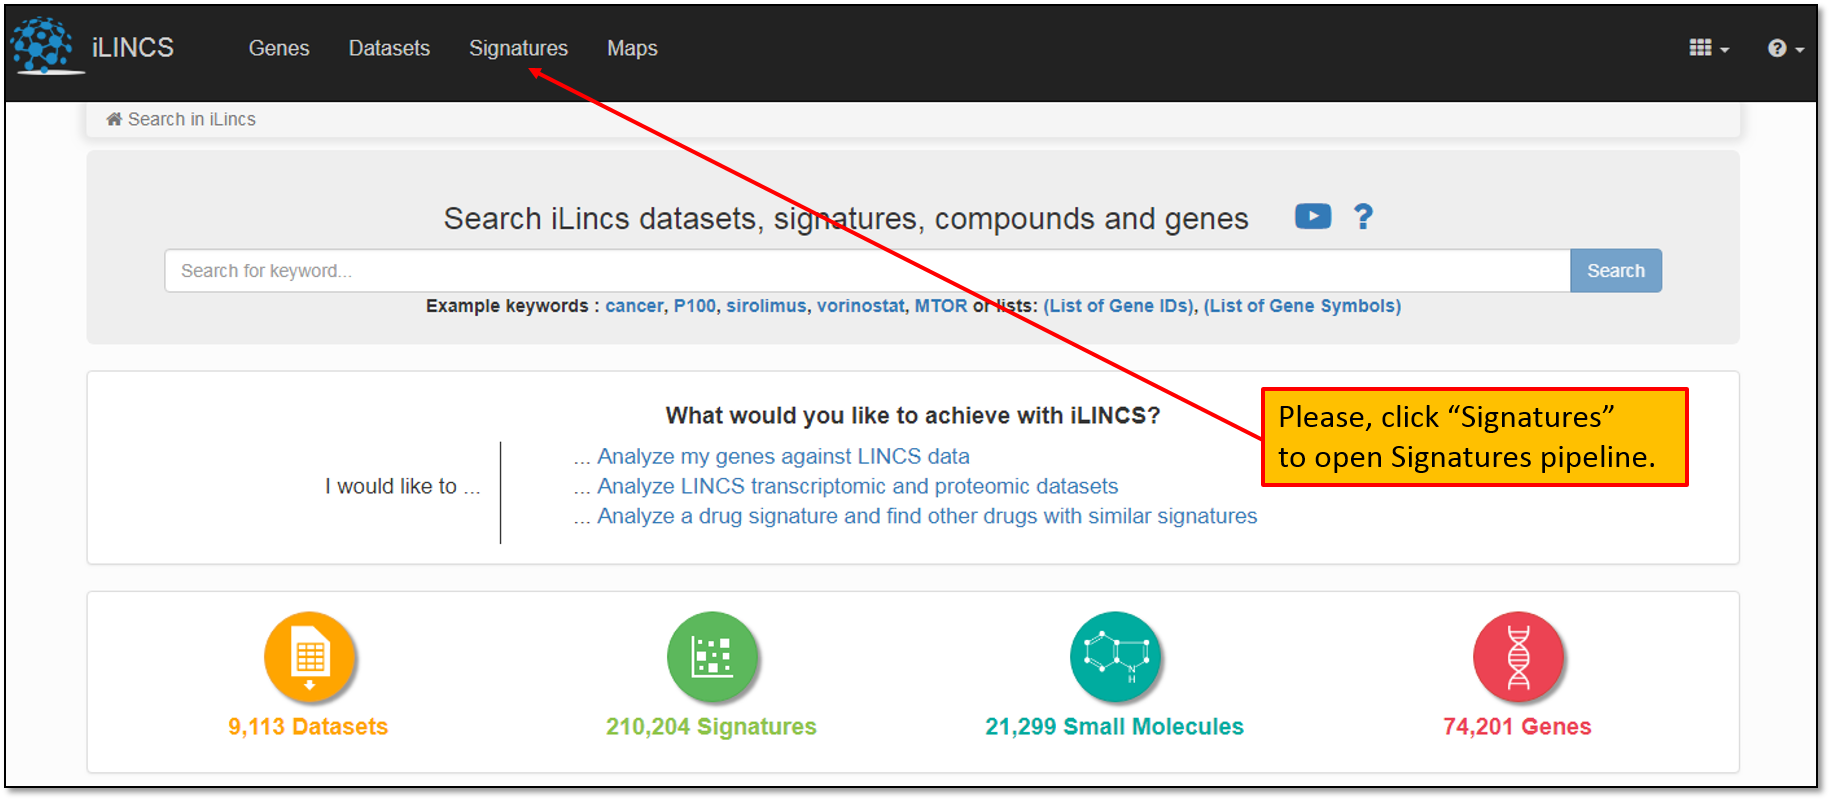
1. First, let's open Signatures Pipeline starting with the iLINCS homepage as shown below.
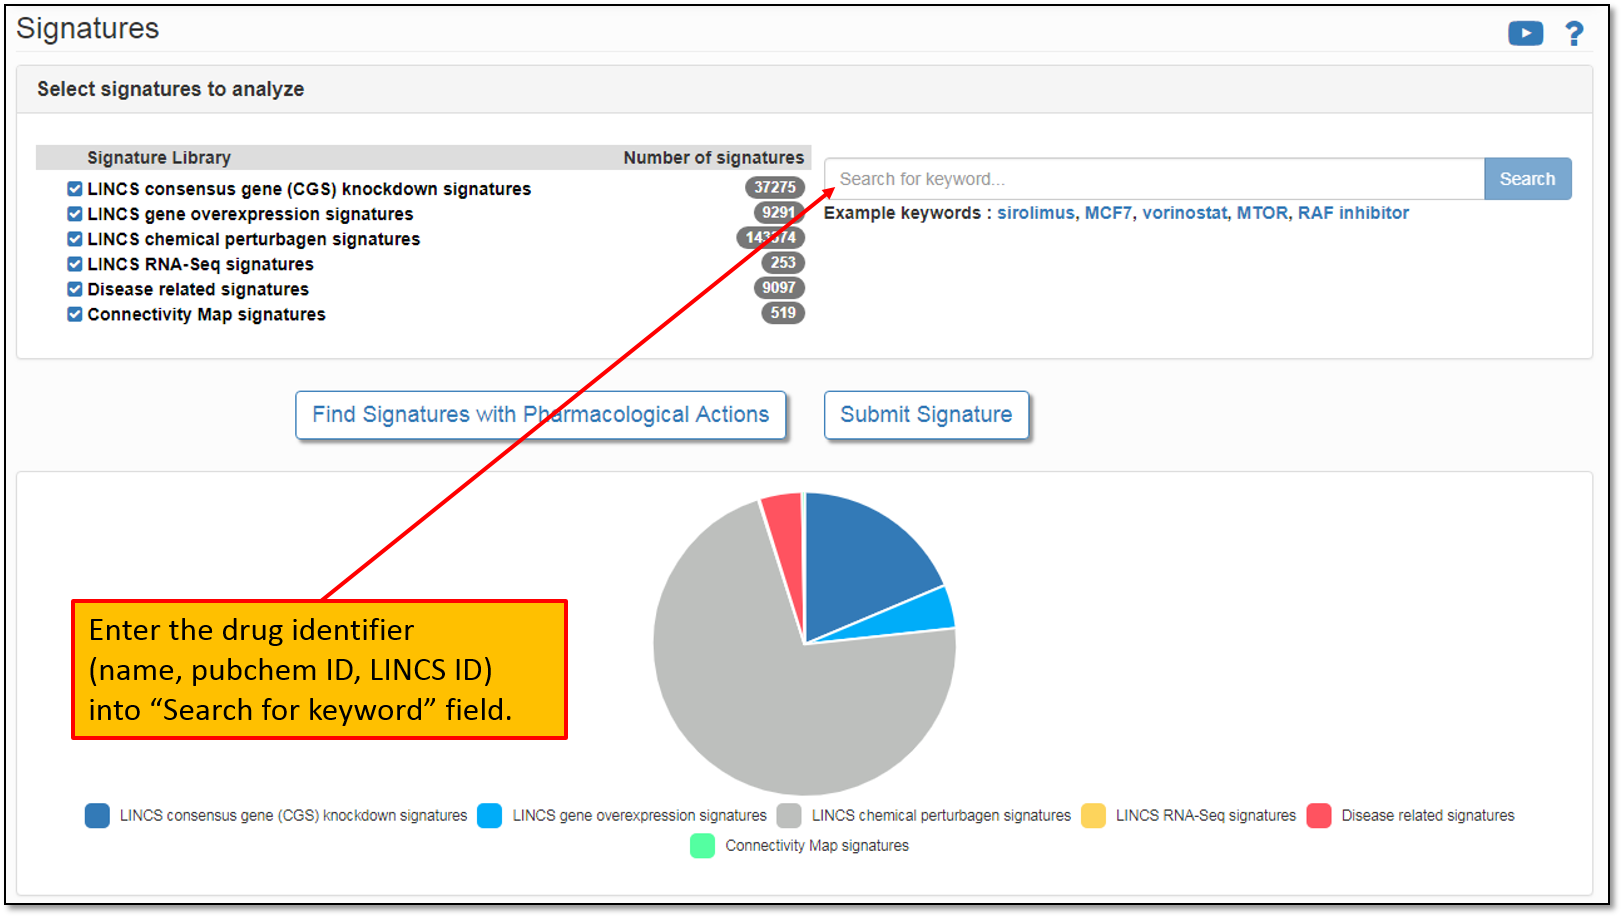
2. This will take you to a Signatures pipeline landing page that lists all pre-computed signatures available for the analysis. At the time of this writing, there were more than 200,000 pre-computed signatures listed on iLINCS. You may enter the drug identifier (name, pubchem ID, LINCS ID) into “Search for keyword" field as shown below.
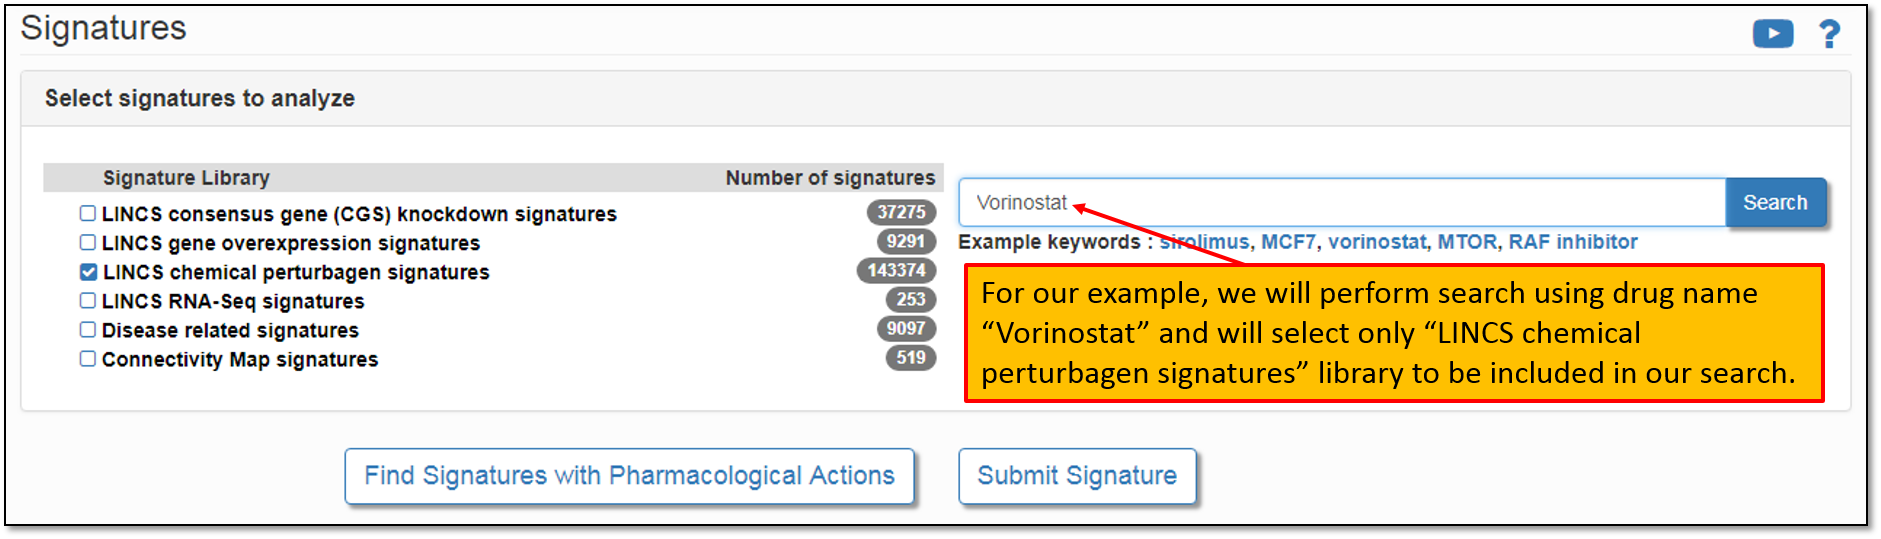
3. Let's say we would like to to analyze signatures that contain our drug of interest, Vorinostat. To do this, let's type in "Vorinostat" in the "Search for keyword" field as shown in the figure below. Moreover, please, keep in mind that the keyword search is performed across all the signature libraries by default. You may perform the default search or simply select a library of interest. Since we are searching for drug signatures, the relevant signature library is "LINCS chemical perturbagen signatures".
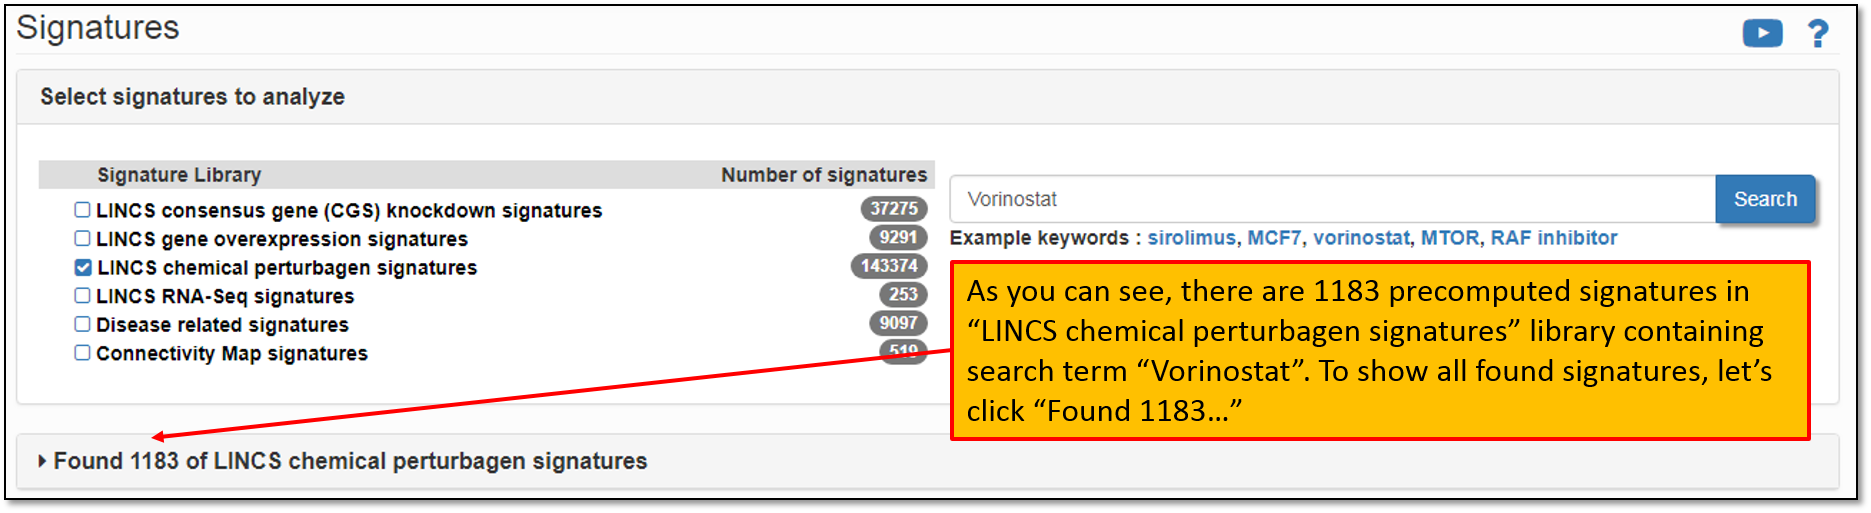
4. As shown in the figure below, there are 1183 pre-computed signatures in the signature library "LINCS chemical perturbagen signatures" containing our drug of interest, Vorinostat. To view all of the found signatures, let's click "Found 1183 in LINCS chemical perturbagen signatures".
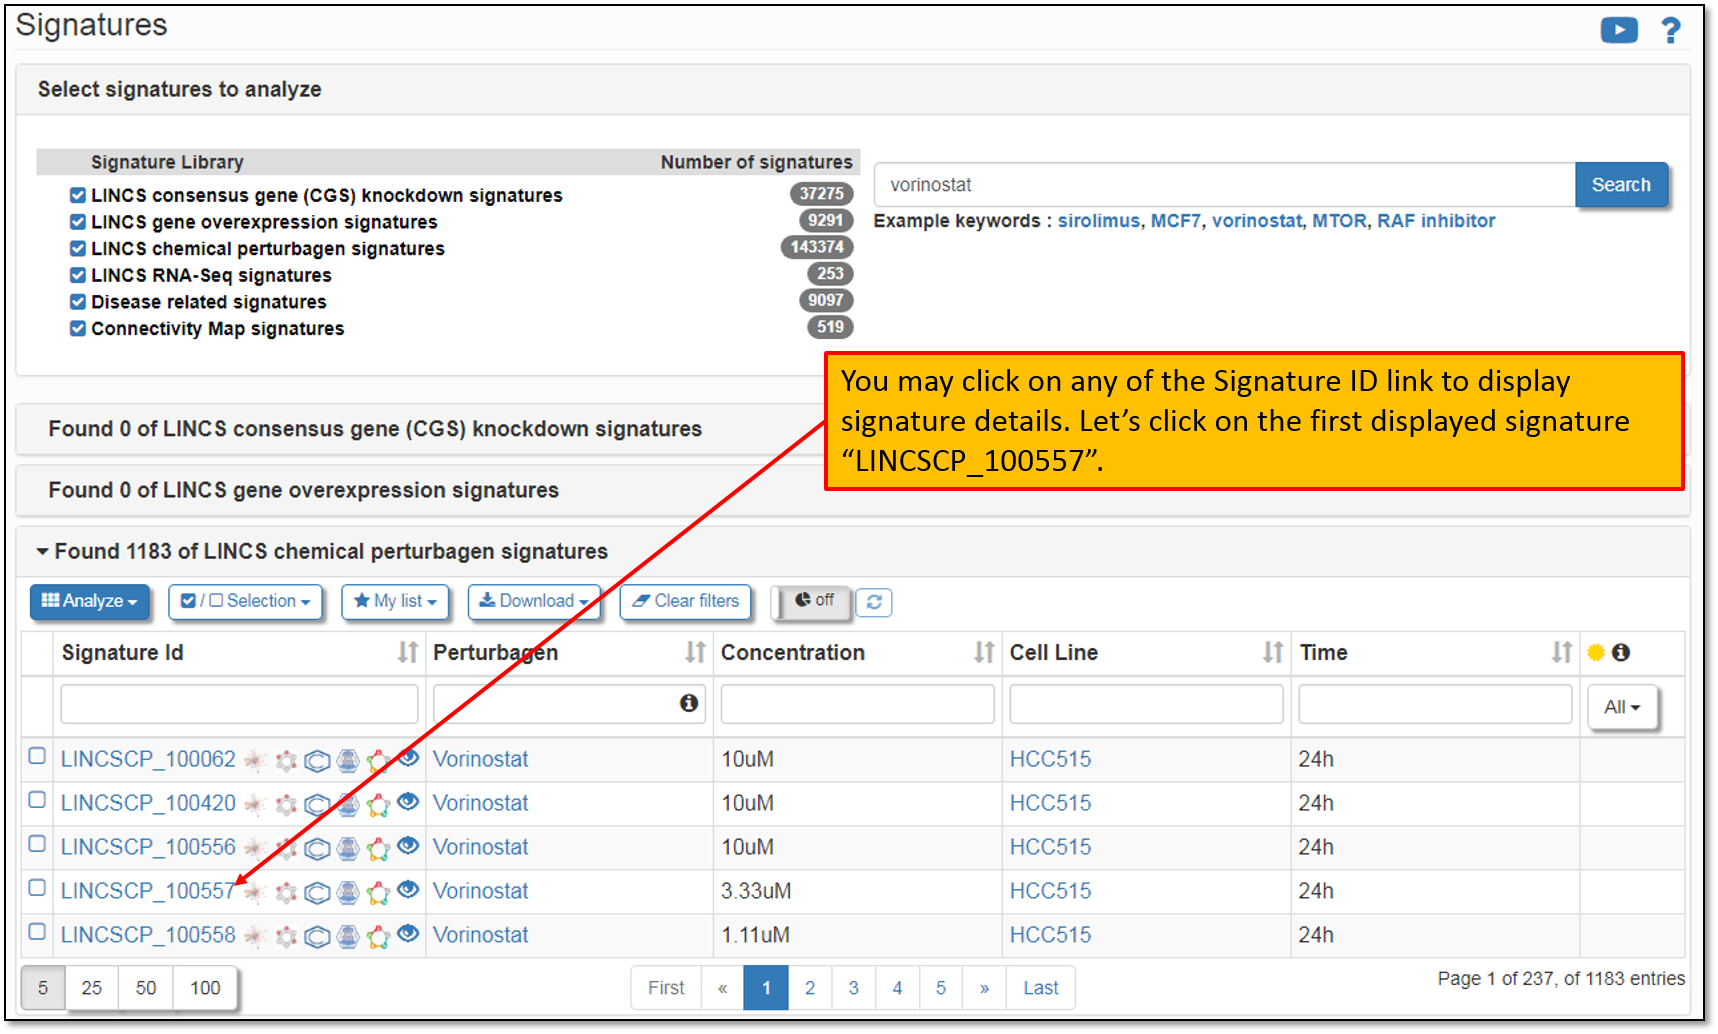
5. Expanding the search results will display all of the found signatures for the current search term. The default settings will display only the first 5 signatures, but you have the option to change this to display them all. You may also sort the displayed signatures by concentration, cell line and time and/or filter signatures based on the selected criteria. Let's say, that we would like to analyze the signature "LINCSCP_100557". Click on the Signature ID to display its details as shown in the figure below.
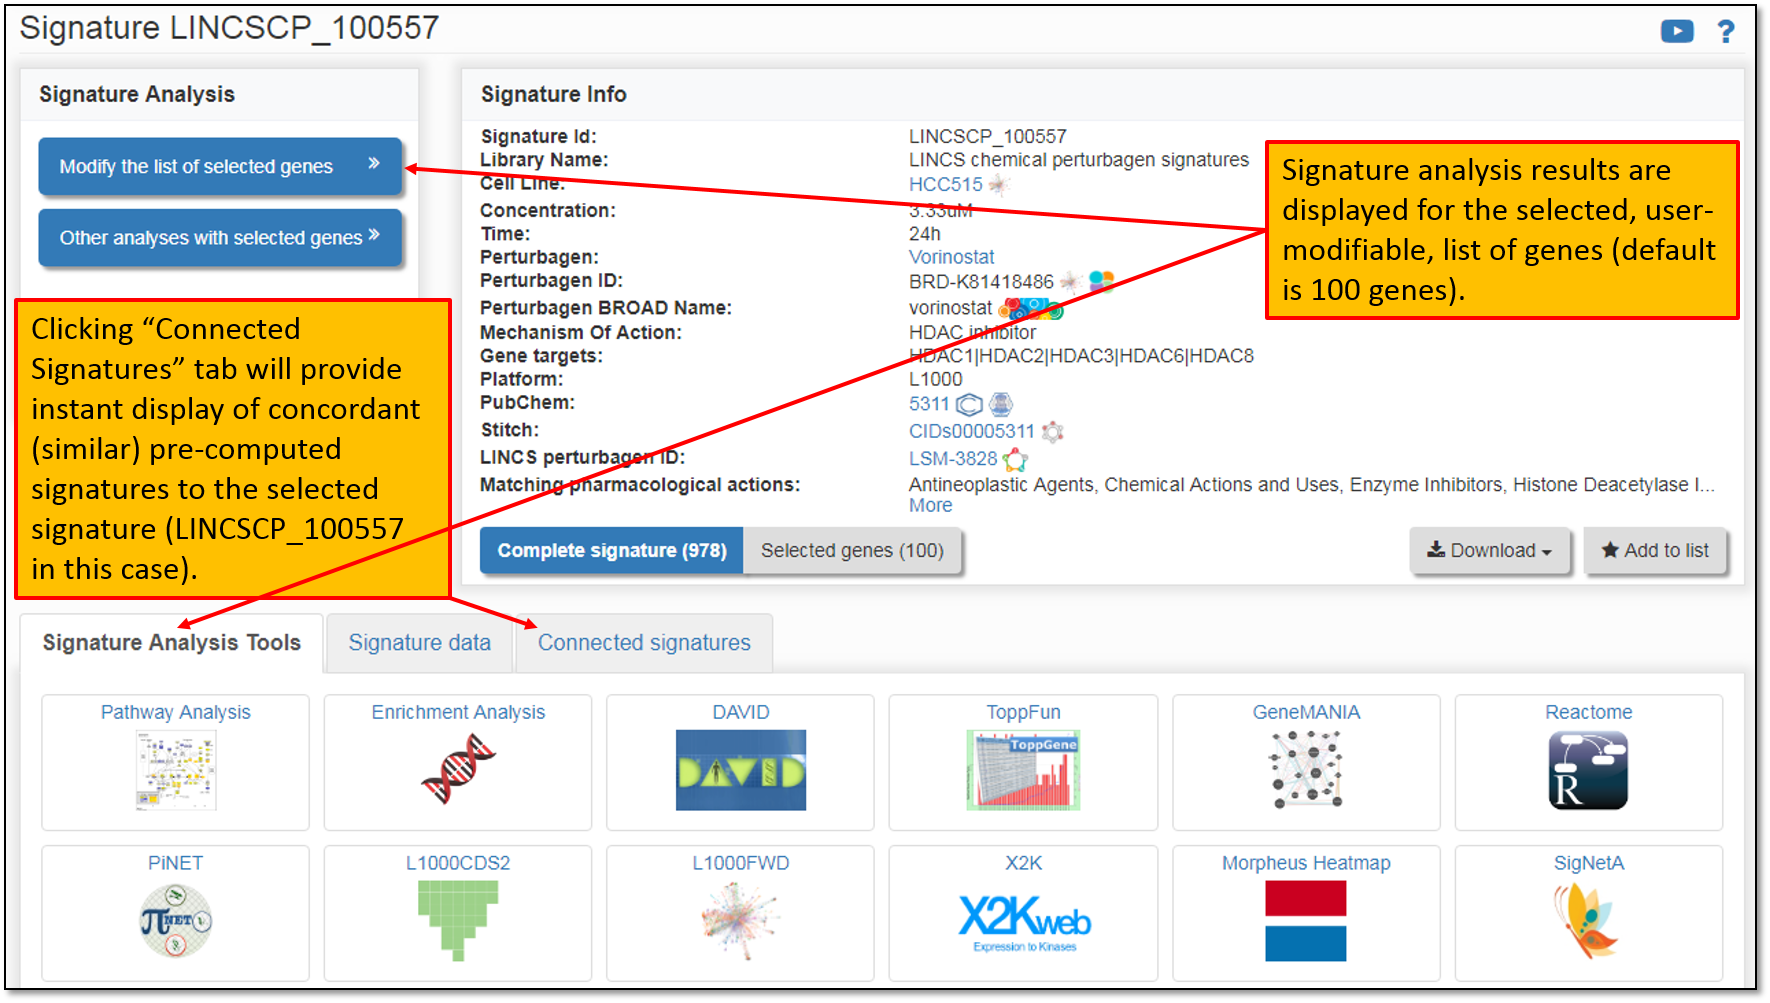
6. As you can see in the figure below, clicking on the Signature ID will display its landing page listing all the details (i.e. available metadata for the signature); signature analysis results for top 100 differentially expressed genes within a signature (you may modify the number of the selected genes to be included in the analysis); as well as instant search for the concordant signatures across all pre-computed signature libraries within iLINCS.
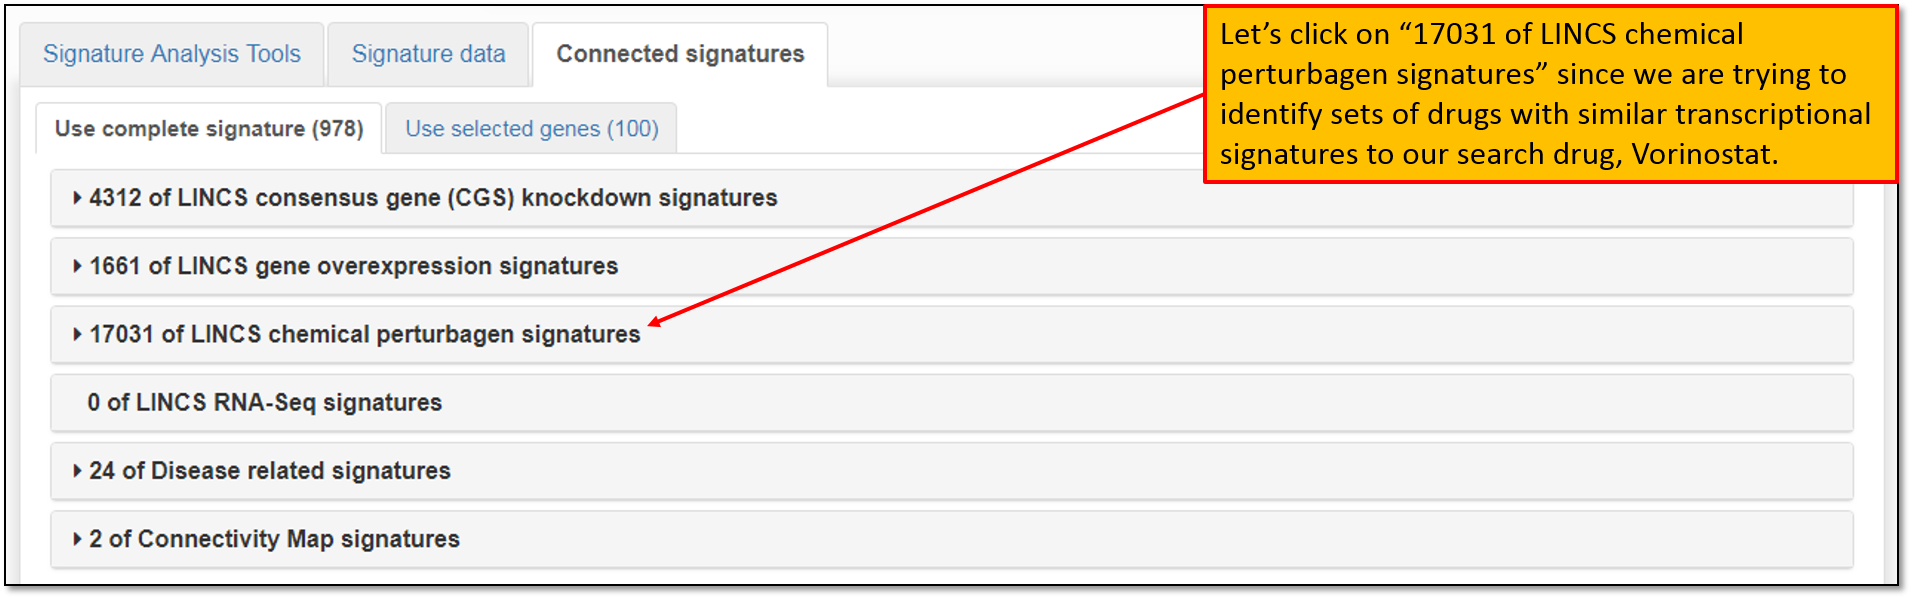
7. We are interested in identifying sets of drugs with similar transcriptional signatures to our drug of interest, Vorinostat, so we will limit our concordant (similar) signatures search to only "LINCS chemical perturbagen signatures" library as shown in the figure below.
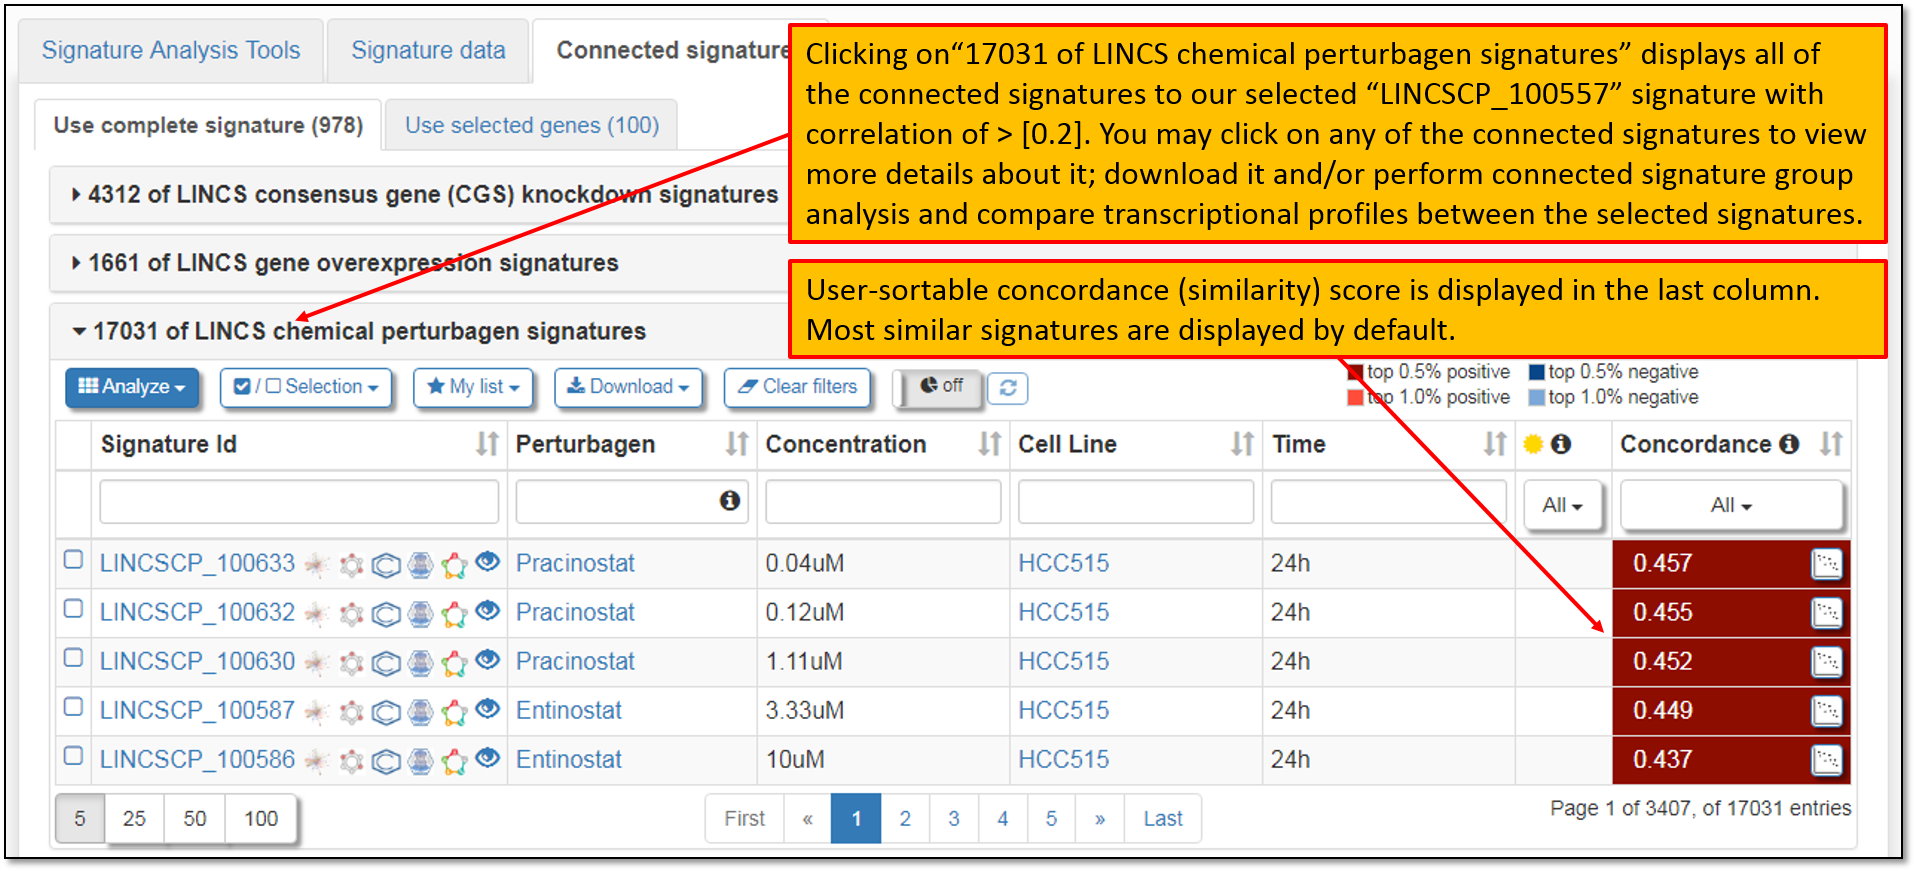
8. Expanding the concordant signature search results within "LINCS chemical perturbagen signatures" library will display signatures that are concordant to our search signature for Vorinostat, "LINCSCP_100557", as seen in the figure below. The concordance values are Pearson correlation coefficients between selected signature and all pre-computed signatures on iLINCS. Signatures with correlations that are greater than absolute value of 0.2 are displayed. The percentiles displayed indicate the portion of signature pairs that are more concordant than the displayed concordance. You may click on any of the concordant signatures to view more details about it; download it or perform concordant signature group analysis to view and compare transcriptional profiles between the selected signatures.
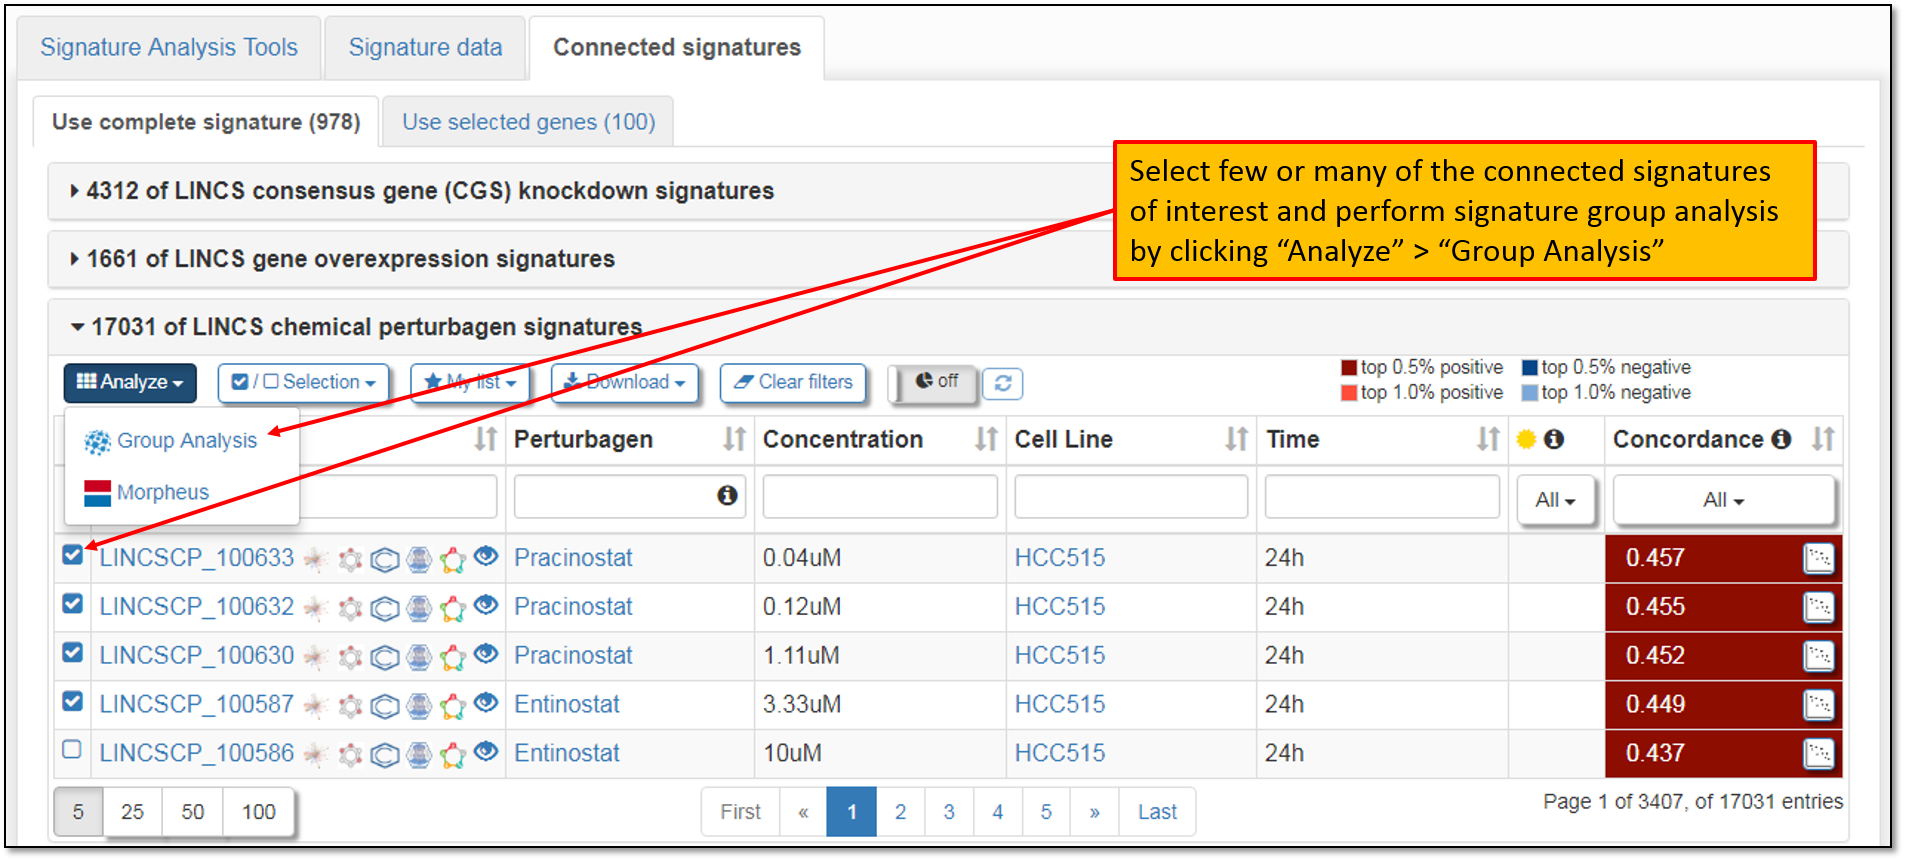
9. As seen in the figure below, signature data for multiple connected signatures are obtainable by clicking the checkbox to the left of the Signature IDs column and performing Signature group analysis. You may select few or many of the connected signatures for the group analysis.
10. Clicking "Group Analysis" will prompt your signature selection verification as seen in the figure below. Selected signatures from your previous analyses will stay in your browsing history, unless you clear your browser cache. Moreover, default number of top differentially expressed genes to be included in the signature group analysis is 50 genes per signature, but you may change this number as needed. After verifying your signature selections, we must click "Analyze 5 signatures" to perform signature group analysis.

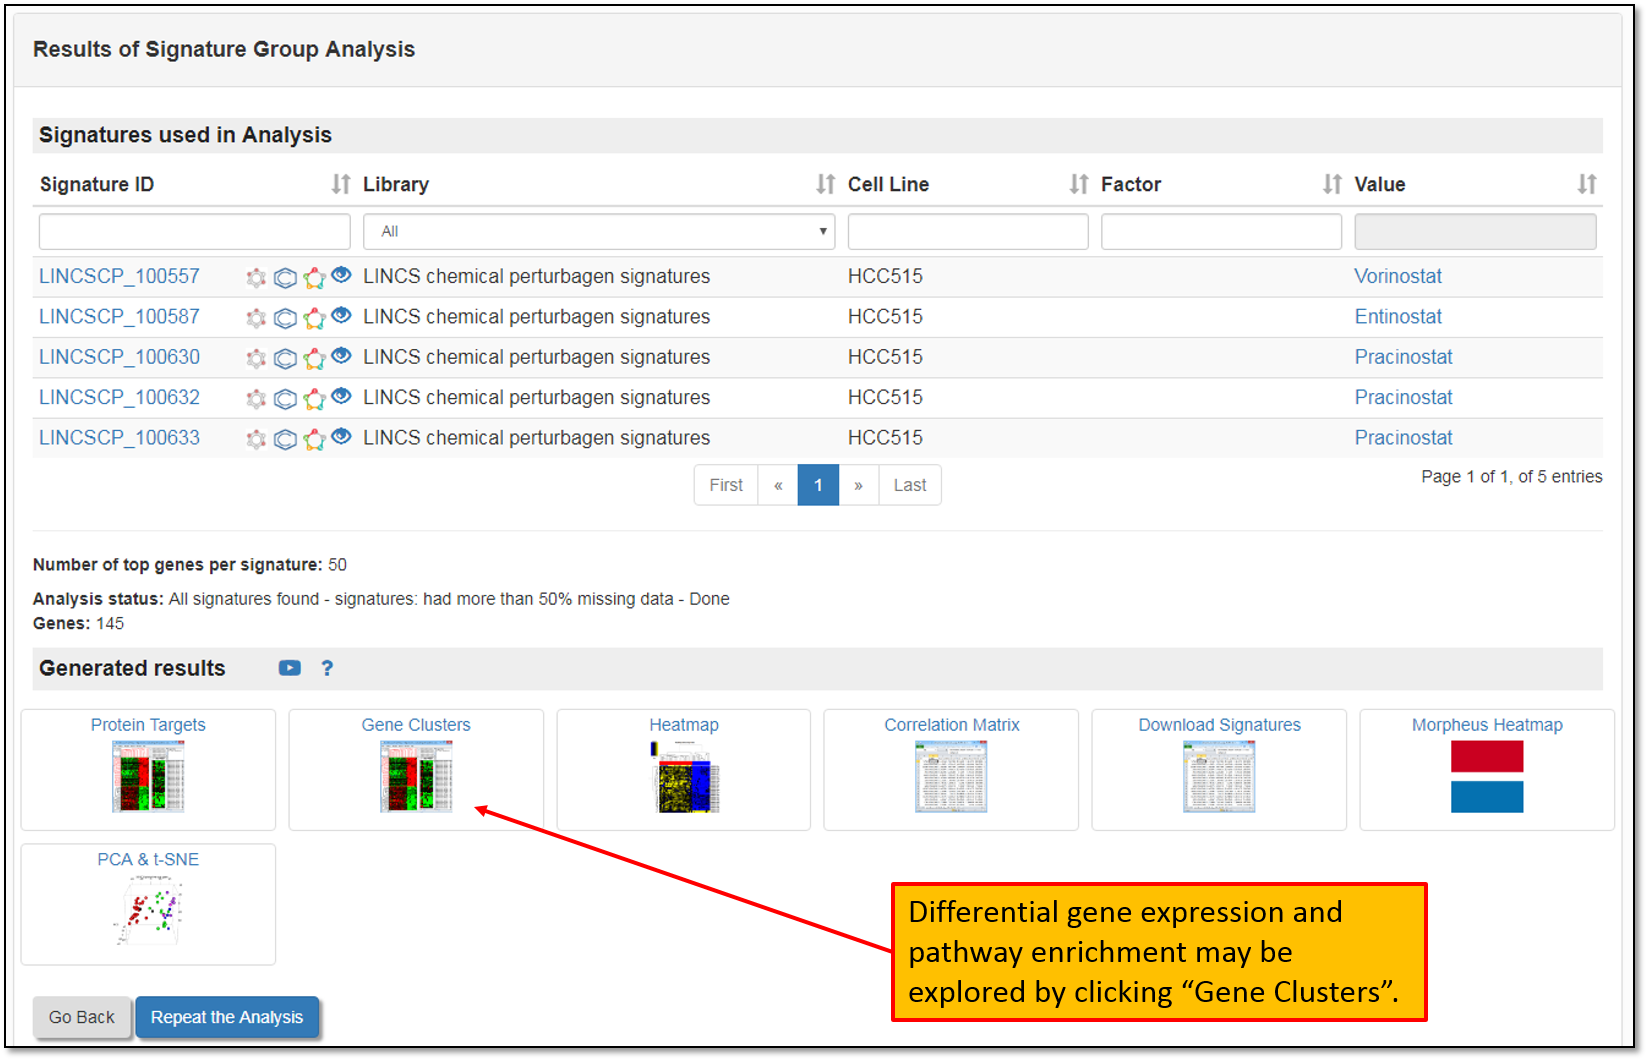
11. The figure below shows Signature group analysis results page (from the step above). Differential gene expression and pathway enrichment for the signatures in a group analysis can be explored by clicking "Gene Clusters".
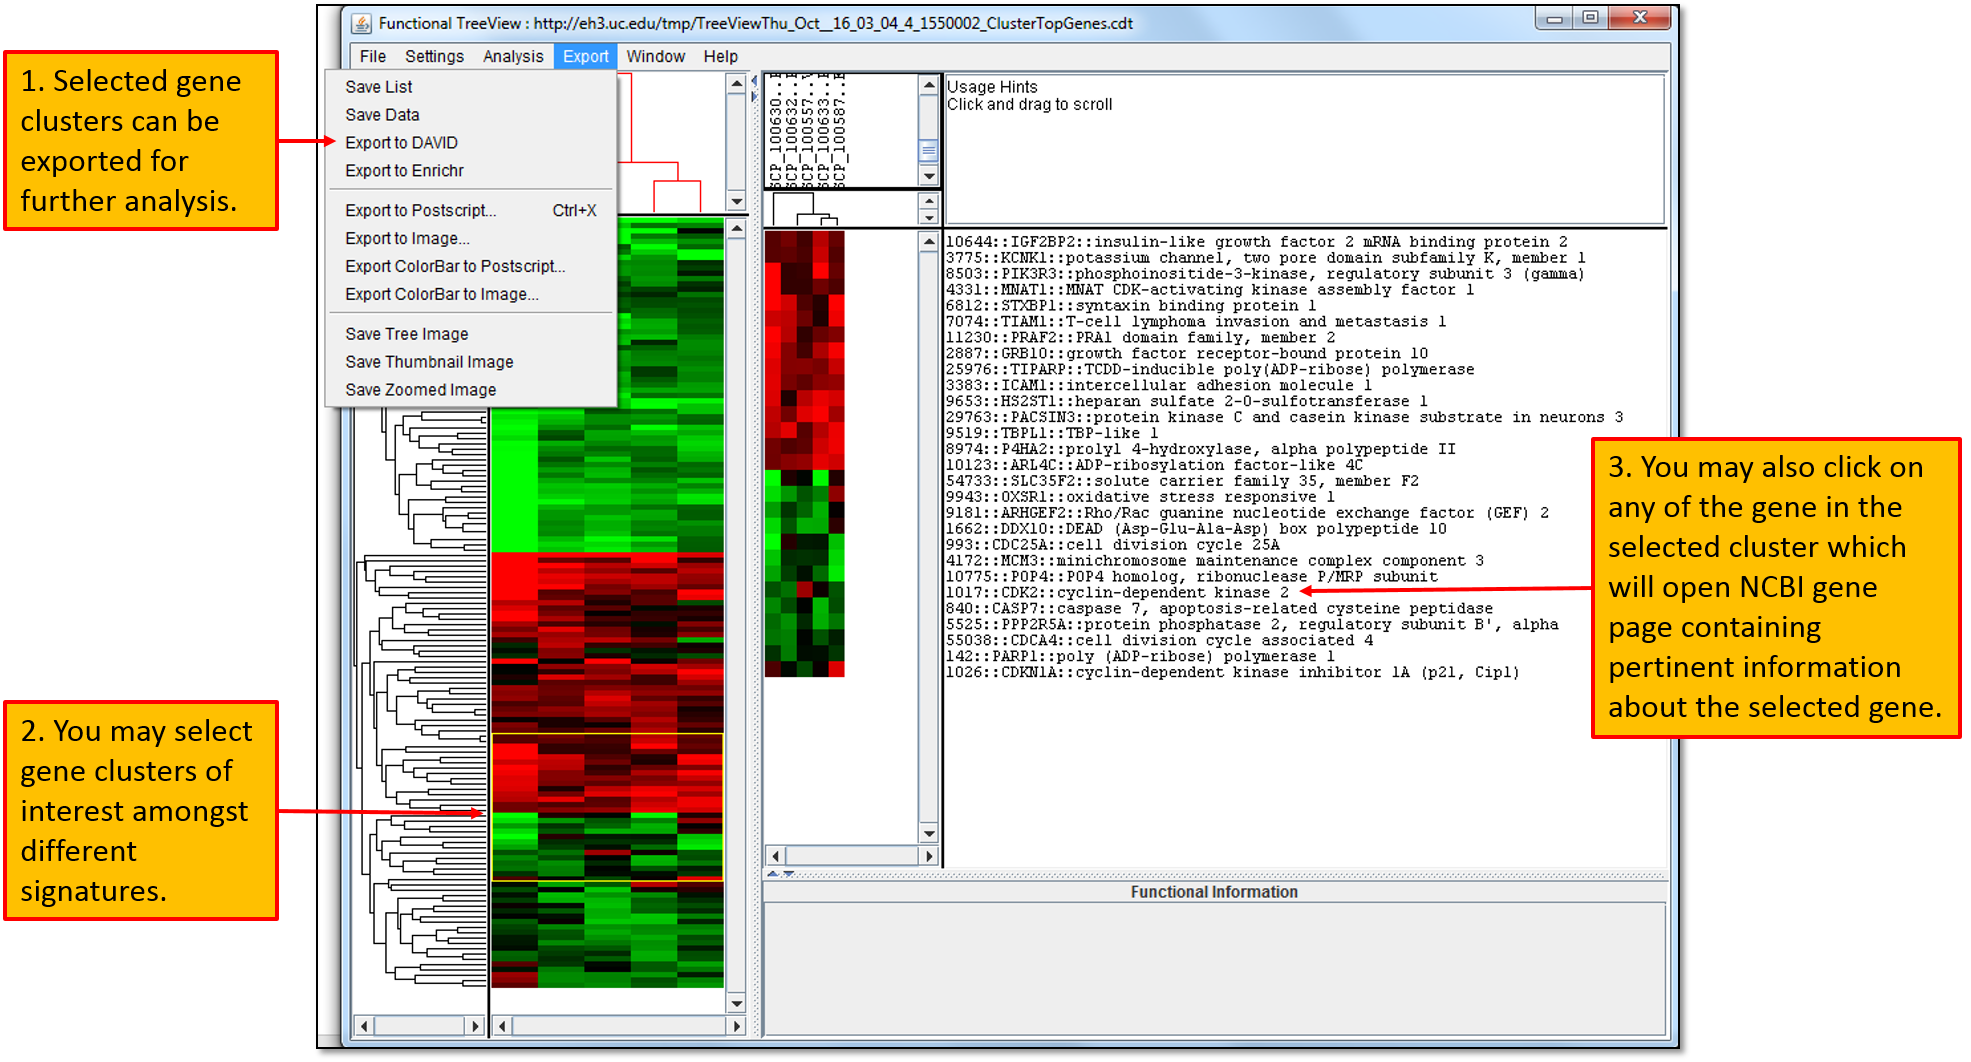
12. Clicking "Gene Clusters" will download a Functional Treeview analysis java file which will allow you to visualize similarly expressed gene clusters amongst the selected signatures as shown in the figure below. Moreover, you may select gene clusters of interest, view genes in the cluster (you can also click on any of the genes in the cluster which will redirect you to the NCBI gene page specific to the selected gene) and you may also export selected genes in the cluster for further analysis.