 GR calculator
 GREIN
GREIN Signeta
Reversing Estrogen Receptor (ER) signature profile
In the following example, we will try to identify a signature(s) that would reverse activated Estrogen receptor transcriptional signature profile. First, we will select Estradiol treatment perturbagen signature in MCF7 (ER+ breast cancer cell line) and then will identify highly disconnected (opposite) signature(s) to reverse its transcriptional signature profile via either gene loss-of-function and/or drug perturbation.
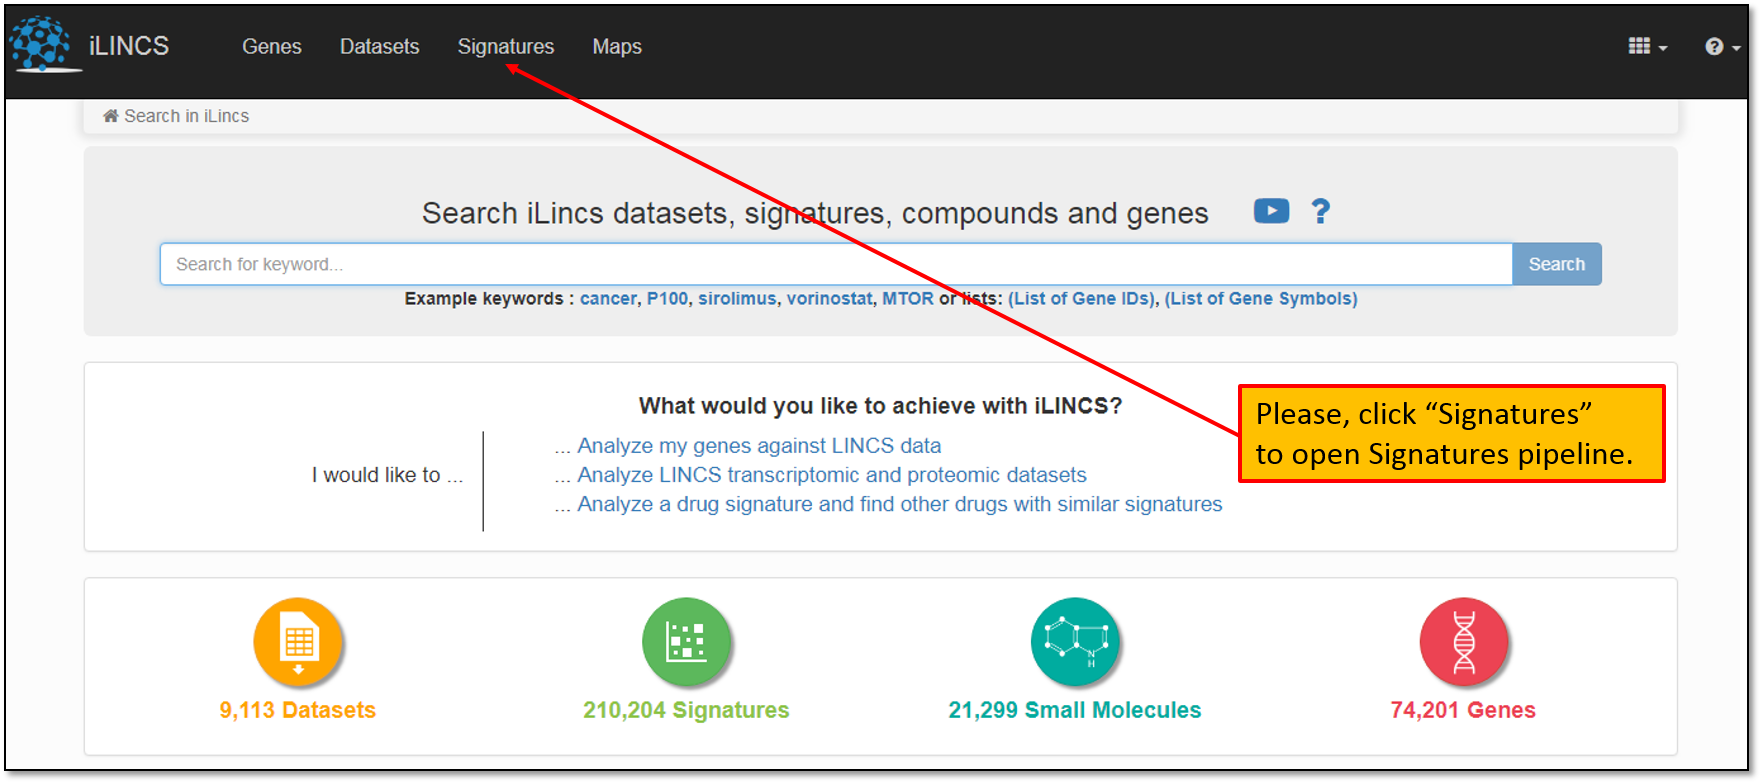
1. First, let's open Signatures Pipeline starting with the iLINCS homepage as shown below.
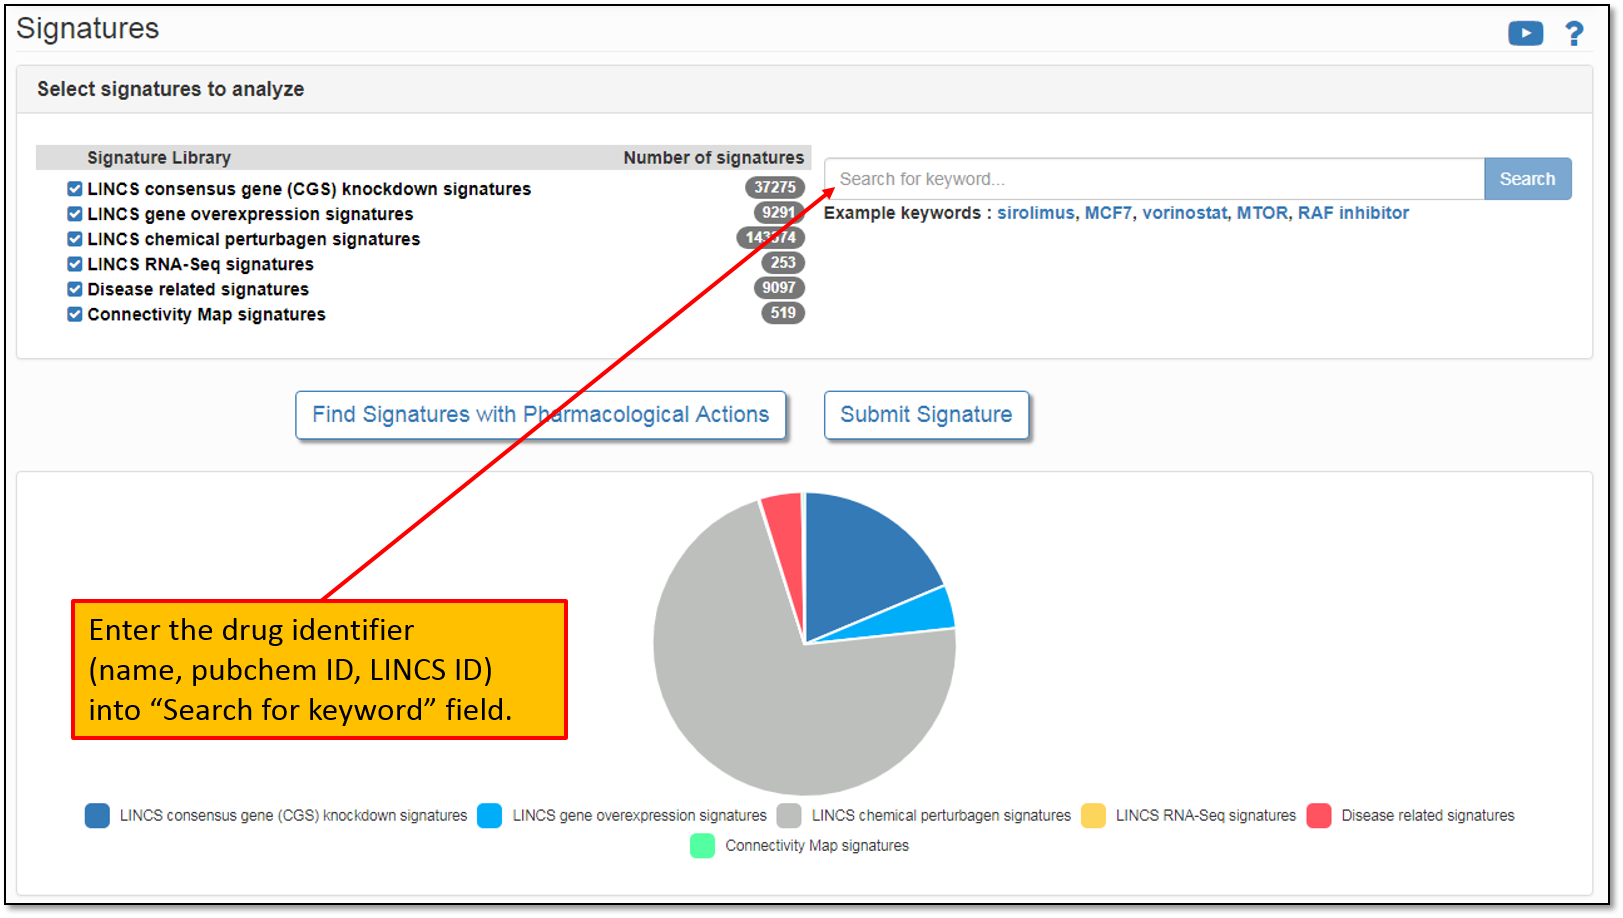
2. This will take you to a Signatures pipeline landing page that lists all pre-computed signatures available for the analysis. At the time of this writing, there were more than 200,000 pre-computed signatures listed on iLINCS. You may enter the drug identifier (name, pubchem ID, LINCS ID) or gene symbol into “Search for keyword" field as shown below.
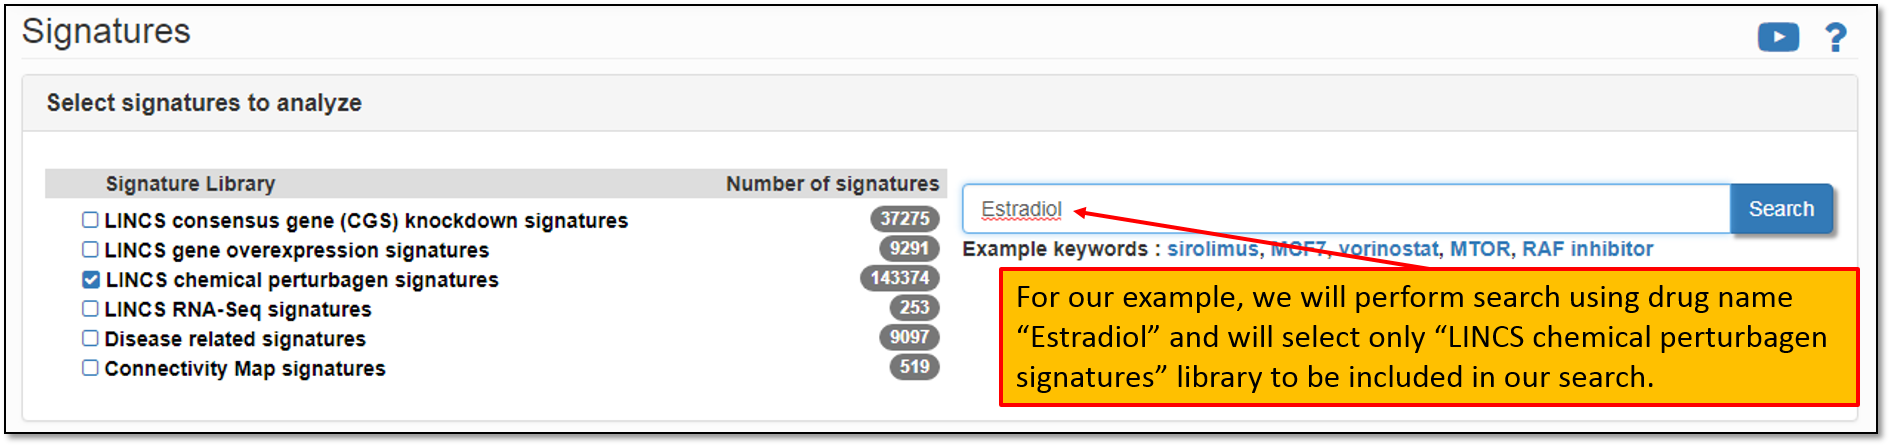
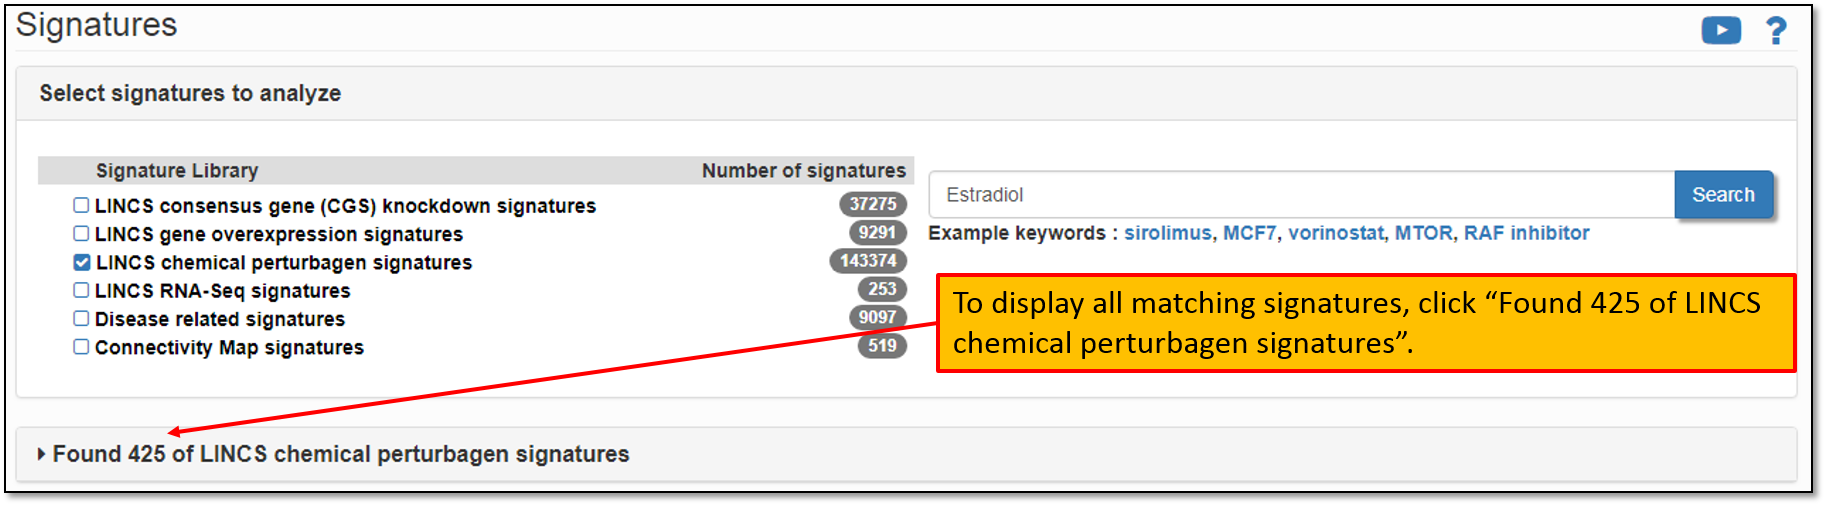
3. For our example, we are interested in identifying activated Estrogen receptor transcriptional signature. Let's type "Estradiol" in the search field to search for Estradiol perturbation signatures. Keyword search is performed across all the signature libraries by default. To restrict iLINCS portal search to only drug perturbation signatures, we must select only "LINCS chemical perturbagen signatures" library as shown in the figure below.
4. As shown in the figure below, there are 425 pre-computed signatures in the signature library "LINCS chemical perturbagen signatures" containing our drug of interest, Estradiol. To view all of the found signatures, let's click "Found 425 in LINCS chemical perturbagen signatures".
5. Expanding the search results will display all of the found signatures for the current search. The default settings will display only the first 5 signatures, but you have the option to change this to display them all. You may also sort the displayed signatures by concentration, cell line and time and/or filter signatures based on the selected criteria. Let's limit search results to 0.01uM Estradiol treatment in MCF7 cells for 6 hours as shown below.
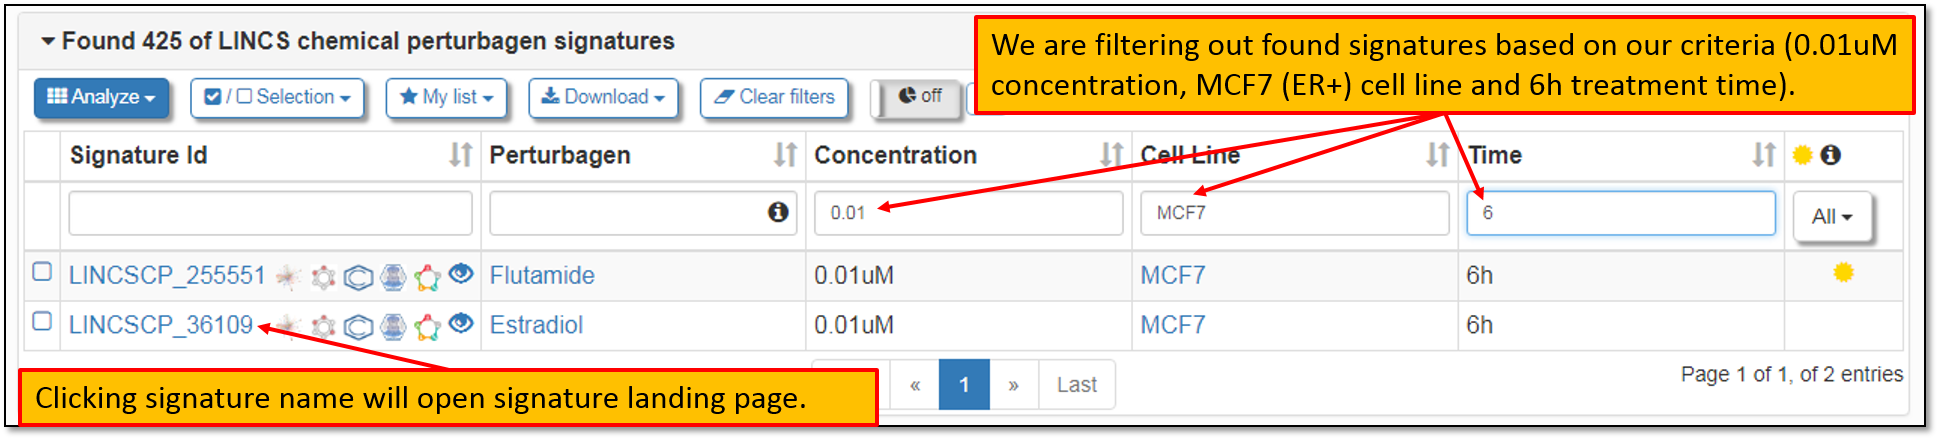
6. Clicking on the signature name will open signature landing page that lists all of the information about the signature and also analysis results for the selected, user-modifiable list of genes (default is 100 genes). We must click "Connected signatures" tab since we are interested in identifying signatures with most opposite transcriptional signature profile to that of activated Estrogen receptor (Estradiol treatment) as shown in the figure below.
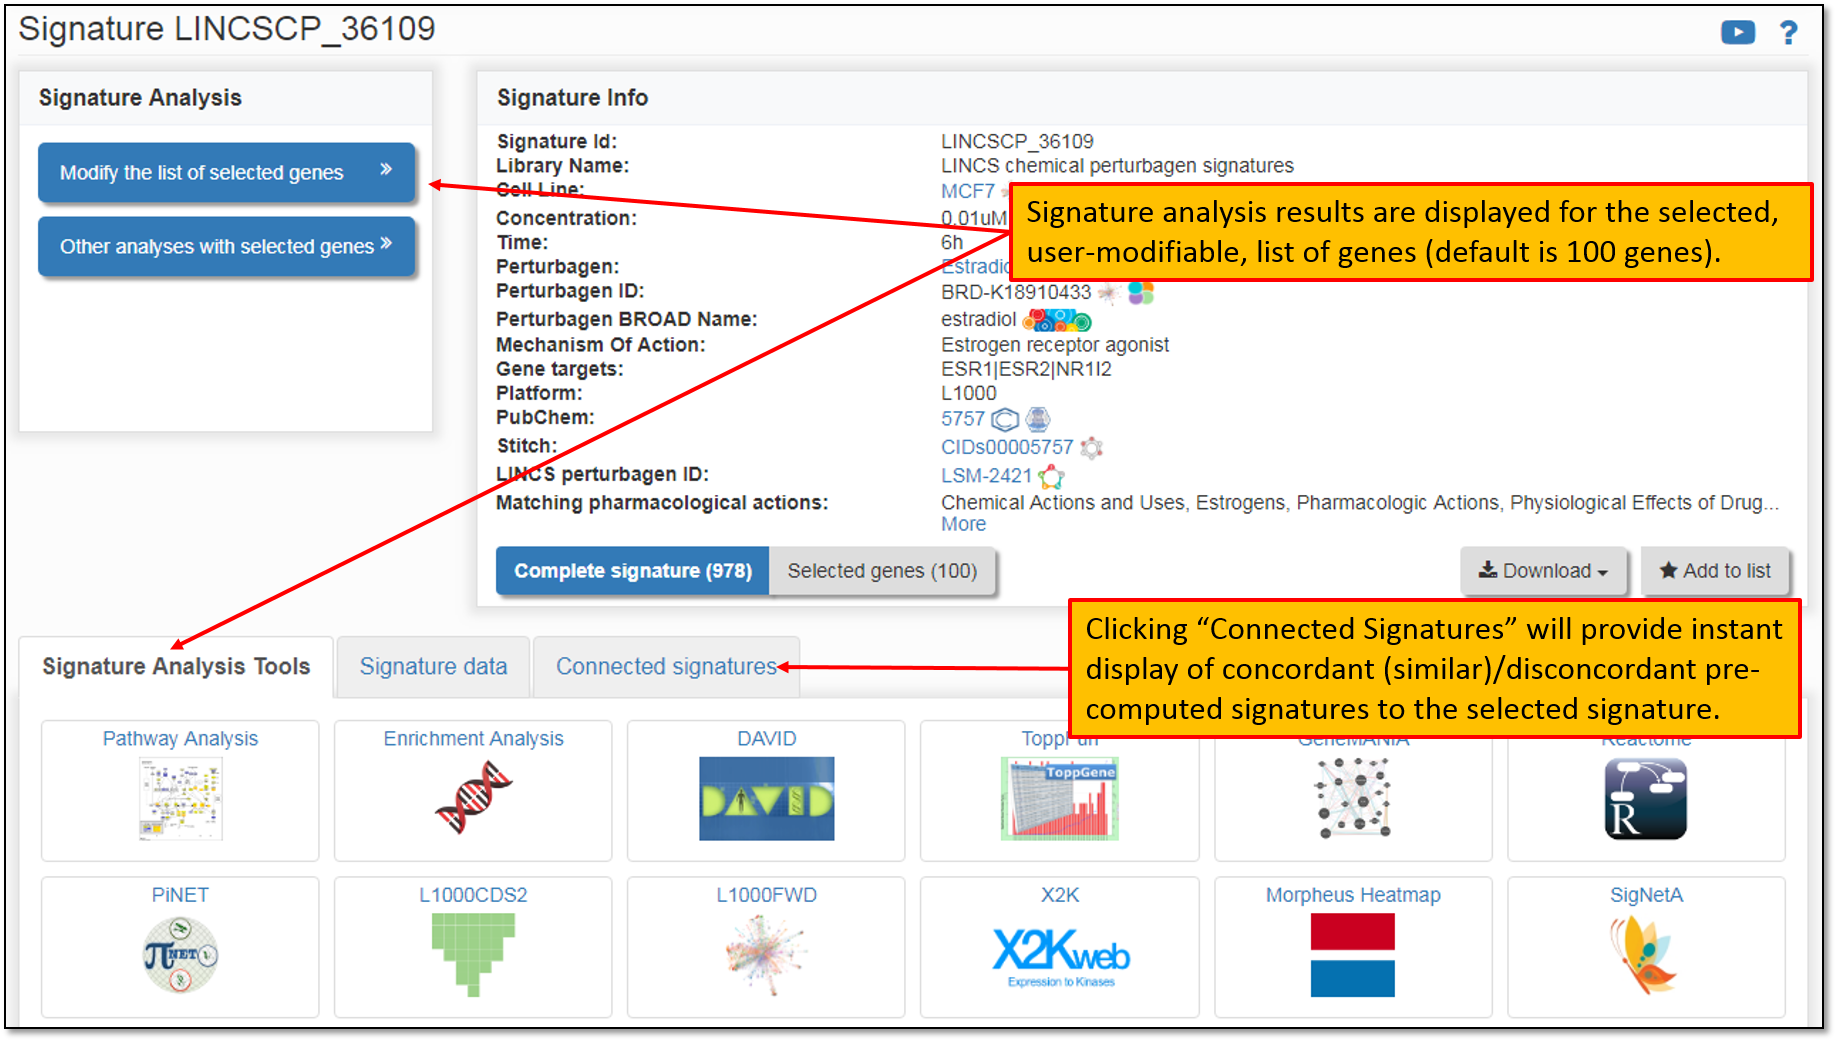
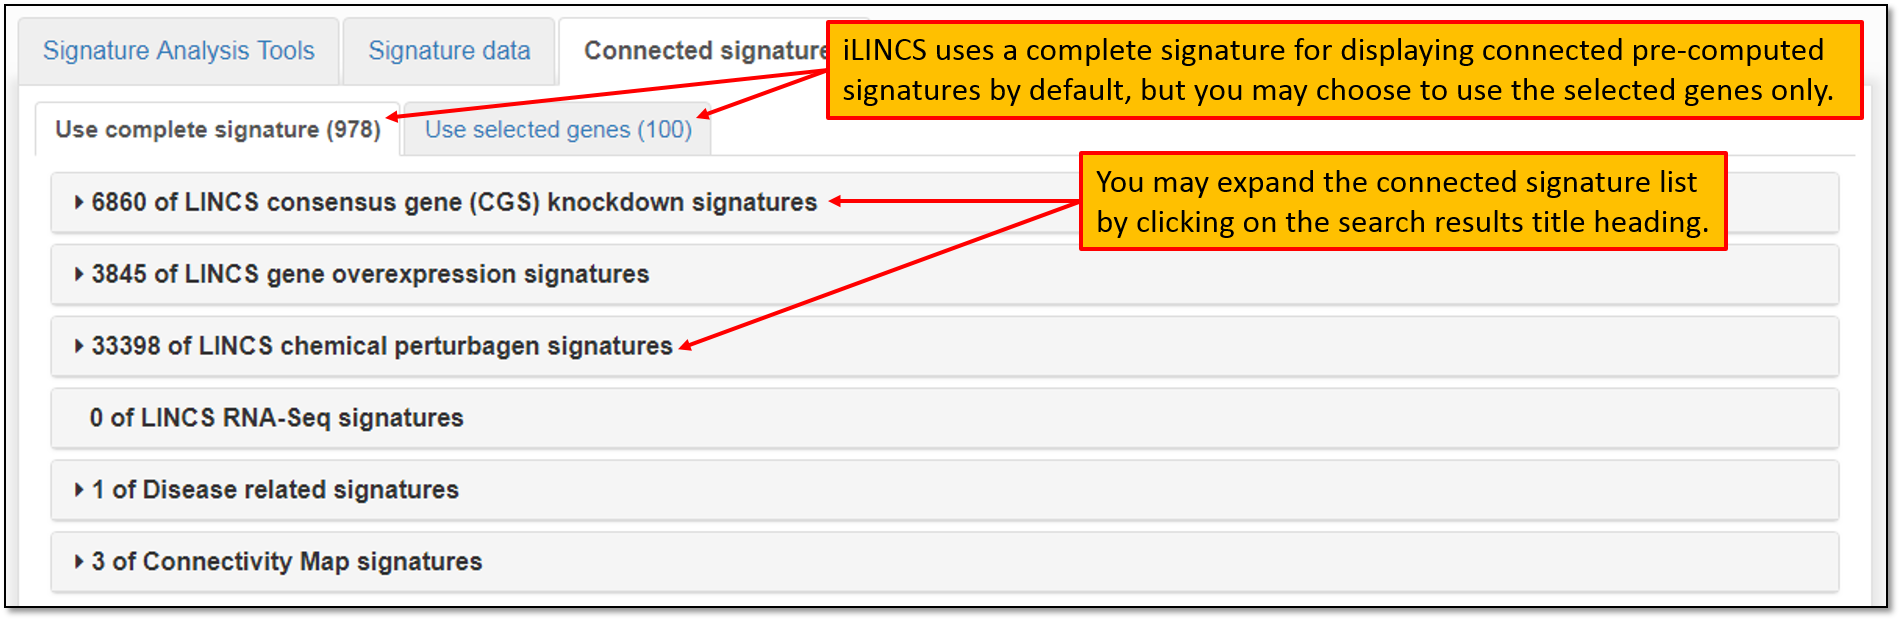
7. As shown in the figure below, clicking on the "Connected Signatures" tab will display connected (either with positive or negative concordance) signatures within all of the pre-computed signature libraries in iLINCS portal to our selected, Estradiol treatment, signature "LINCSCP_36109" (figure above). iLINCS uses a complete signature by default for displaying pre-computed connected signatures, but you may instruct iLINCS to use only a subset of the signature (select genes only). We are going to use a complete signature (trancsriptional profile of all genes within a signature) since we are interested in identifying connected signatures of the perturbations that have the most opposite transcriptional signature profile to that of the activated Estrogen receptor. To explore signatures of knockdown genes (loss-of-function) that would potentially reverse Estradiol treatment signature, we will click on "6860 of LINCS consensus gene (CGS) knockdown signatures". To identify signatures of drug perturbations that would potentially reverse Estradiol perturbation signature, we will then browse drug perturbation signatures by clicking "33398 of LINCS chemical perturbagen signatures".
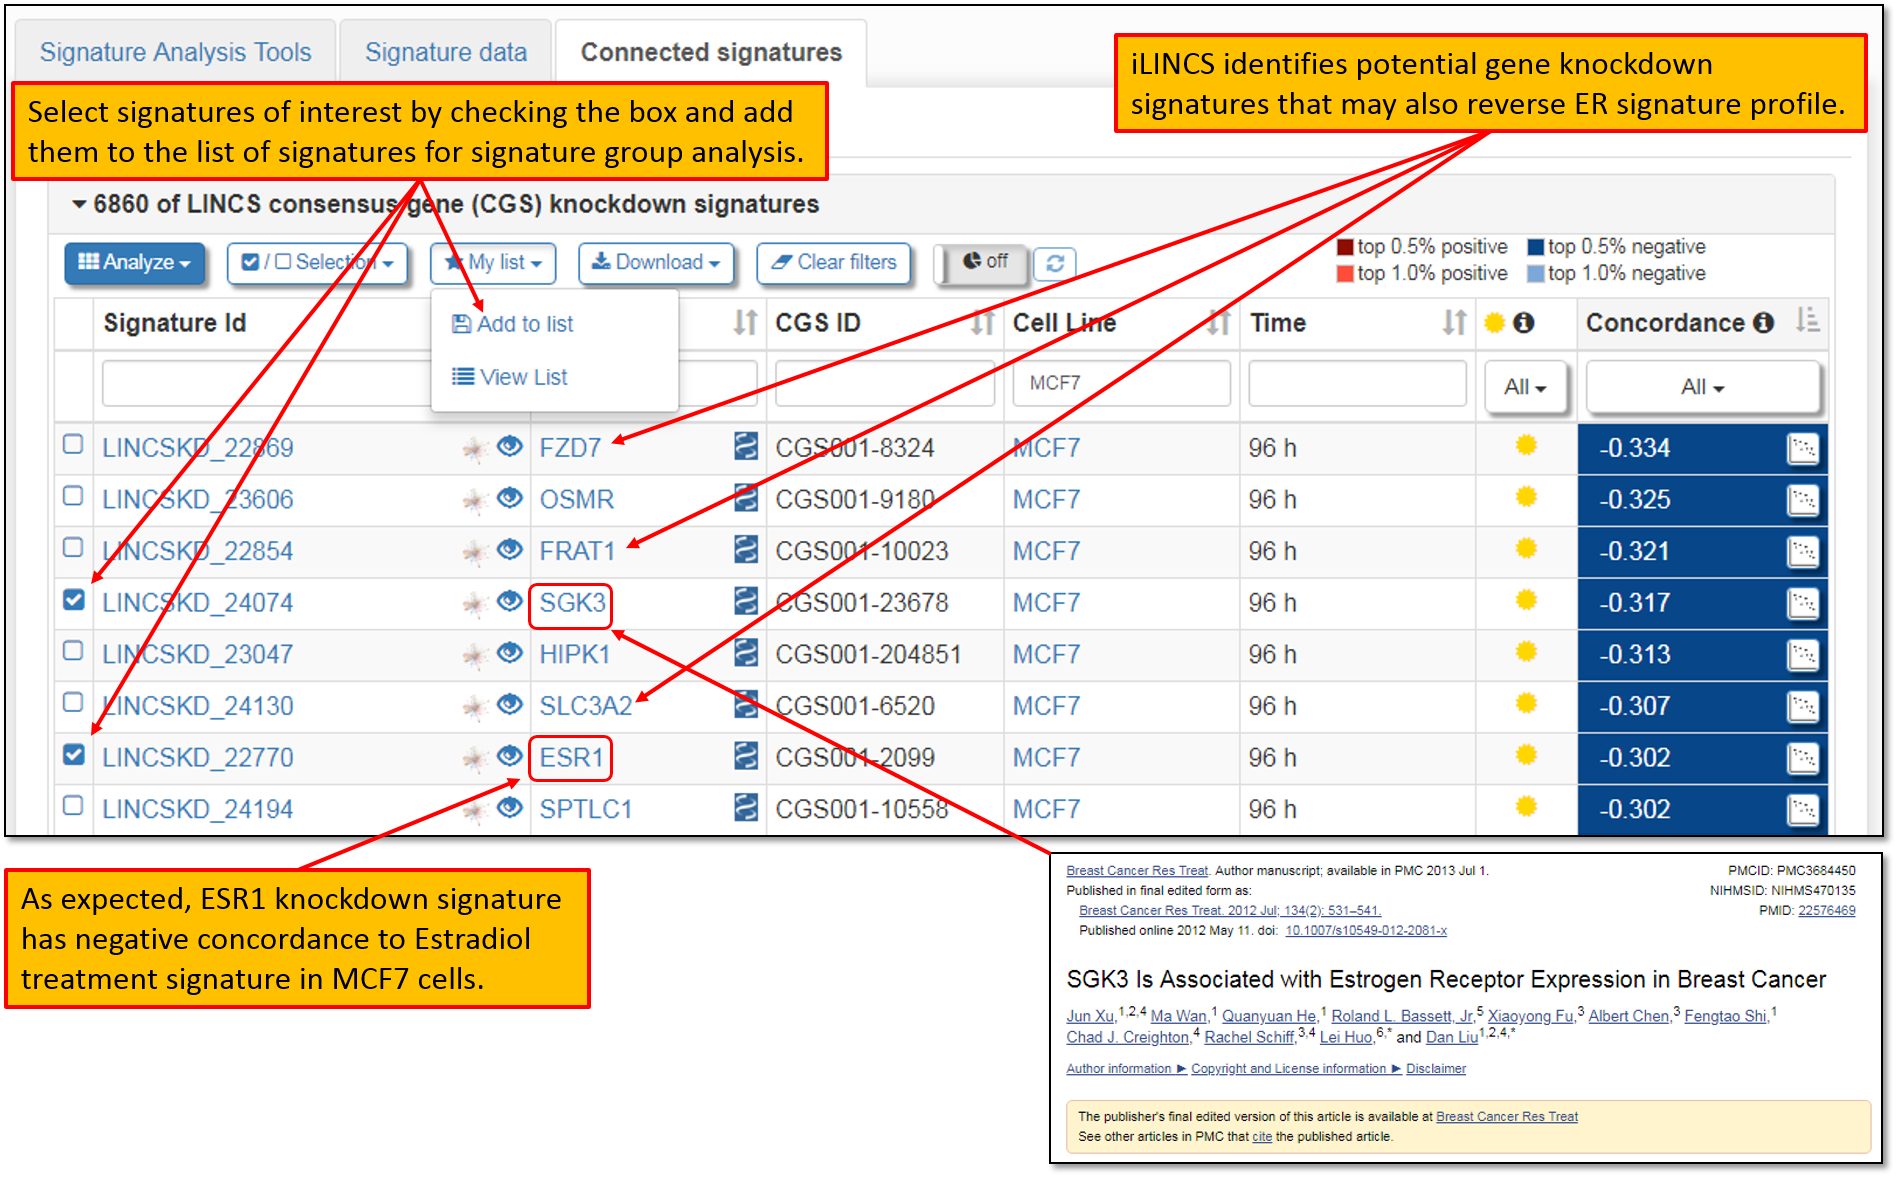
8. As seen in the figure below and as expected, one of the highly dis-concordant signatures to our selected Estradiol treatment, "LINCSCP_36109" signature is transcriptional signature of the Estrogen receptor (ESR1) gene knockdown. Note that concordance value is not the top value for these two signatures since LINCS gene knockdown as well as chemical perturbation signatures only include select 978 genes (L1000) which may not reflect ER pathway in its entirety. Furthermore, iLINCS identifies potential gene knockdown signatures that may reverse ER signature profile. One of them, SGK3, has been shown to be associated with Estrogen receptor expression. We will select signatures of interest by checking the box to the left of the signature(s) and add them to the list of signatures for the signature group analysis by clicking "My list" > "Add to list".
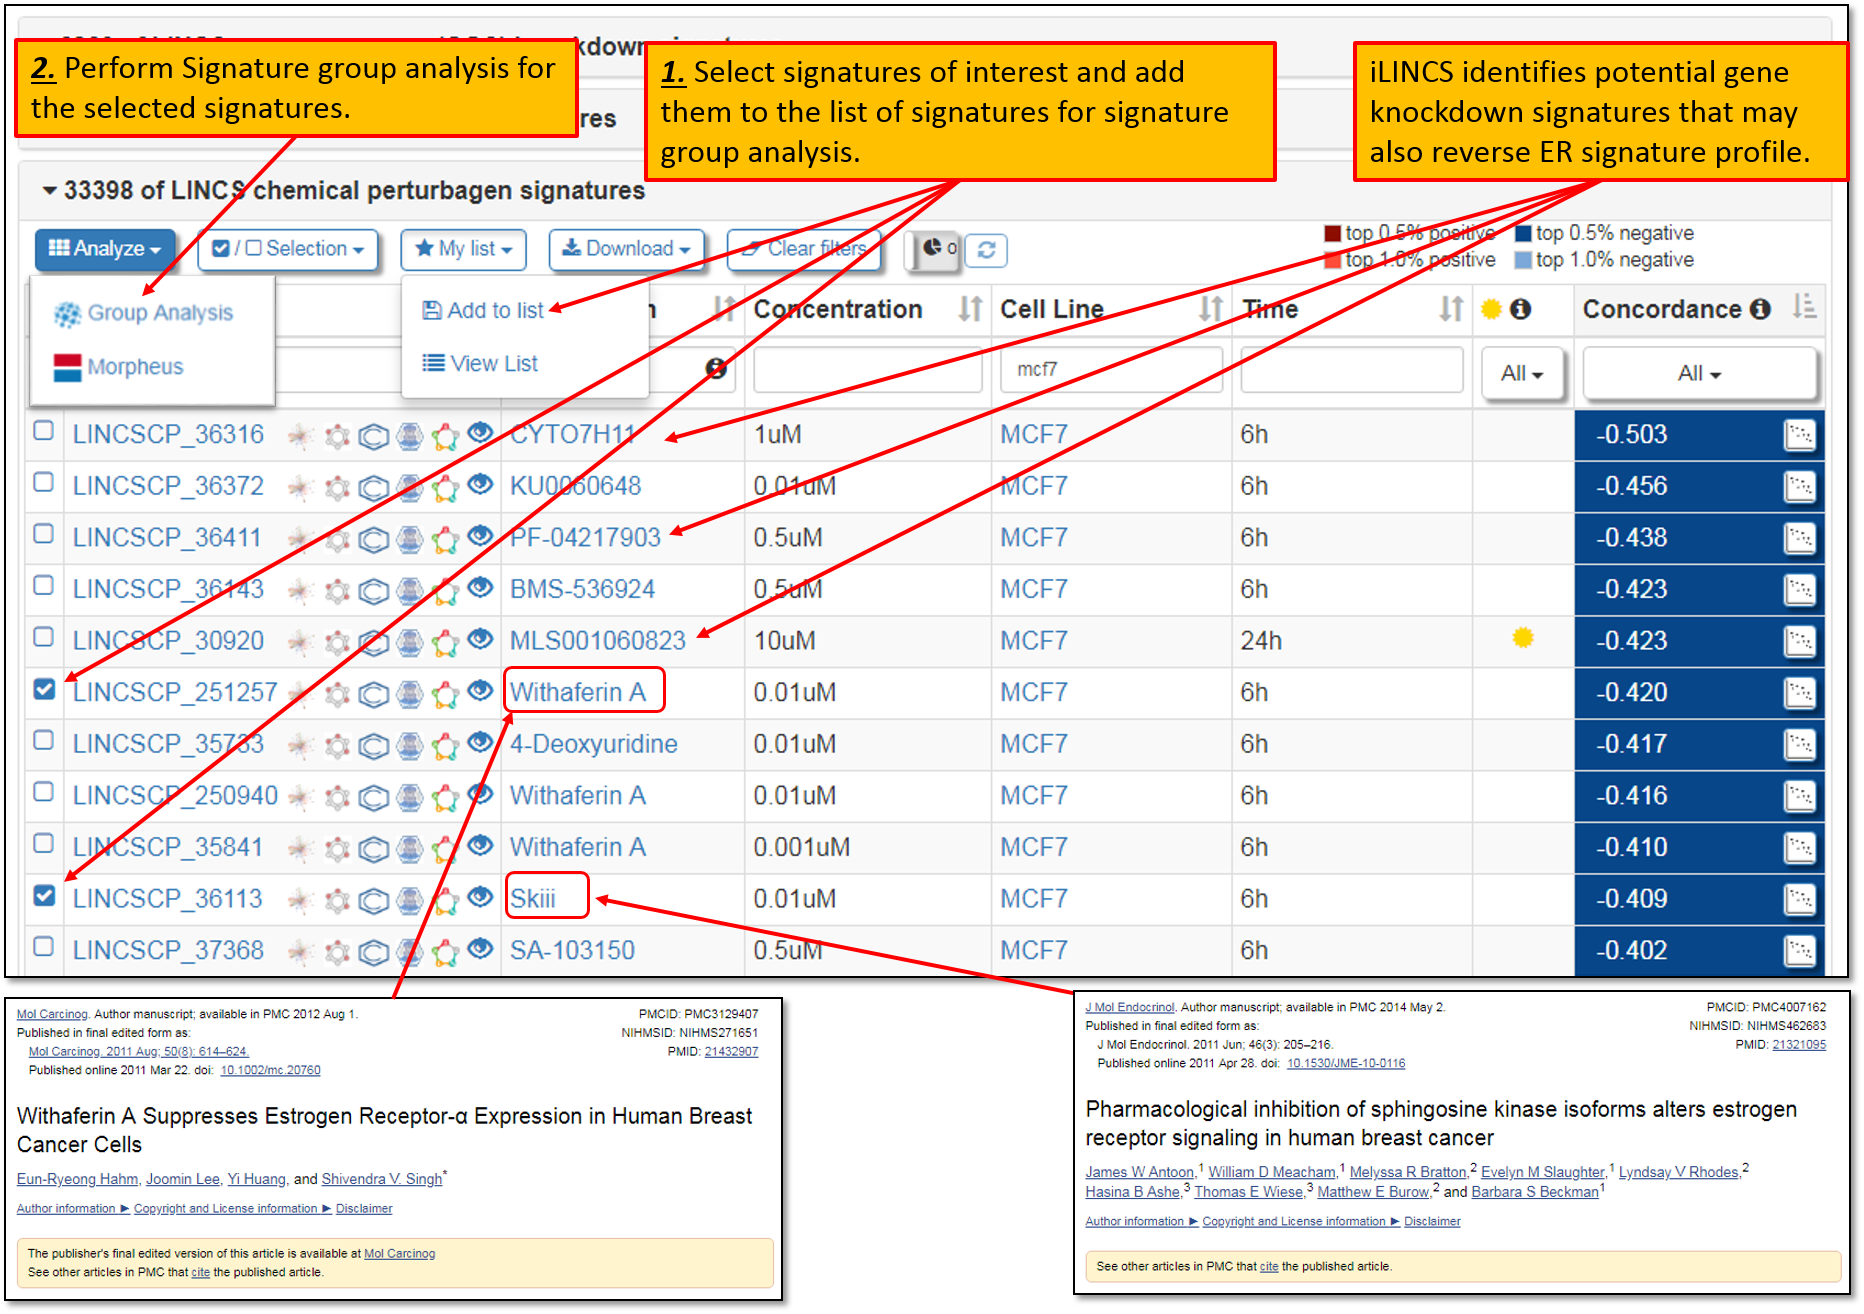
9. We have identified few of gene knockdown transcriptional signatures that may reverse activated ER transcriptional signature (figure above). Next we will explore and try to identify signature(s) of drug perturbations that may also have the opposite transcriptional signature to that of the activated ER. To expand the list of connected signatures of drug perturbations, we will click "33398 of LINCS chemical perturbagen signatures". We will also filter down for relevant signatures by typing "MCF7" in the "Cell Line" field column. To sort the concordant signatures, we may click double arrows in the "Concordance" column. Sorting for negative concordance provides us with a list of drug perturbation signatures that may reverse activated ER signature. Two of the drugs from the list, Withaferin A and Skiii, have been shown to negatively regulate ER signaling. We will select signatures of interest; add them to the list of signatures for signature group analysis by clicking "My List" > "Add to list" (we already have 2 signatures for ESR1 and SGK3 knockdowns from the step above) and will perform signature group analysis by clicking "Analyze" and then selecting "Group Analysis" from the pull-down menu options.
10. Clicking "Group Analysis" will prompt for your signature selection verification as seen in the figure below. Selected signatures from your previous analyses will stay in your browsing history, unless you clear your browser cache. Moreover, default number of top differentially expressed genes to be included in the signature group analysis is 50 genes per signature, but you may change this number as needed. As shown in the figure, the selected signatures include our selections for ESR1 and SGK3 gene knockdowns that we have selected earlier as well as our recent drug perturbation signature selections for Withaferin A and Skiii. After verifying your signature selections, we must click "Analyze 5 signatures" to perform signature group analysis.

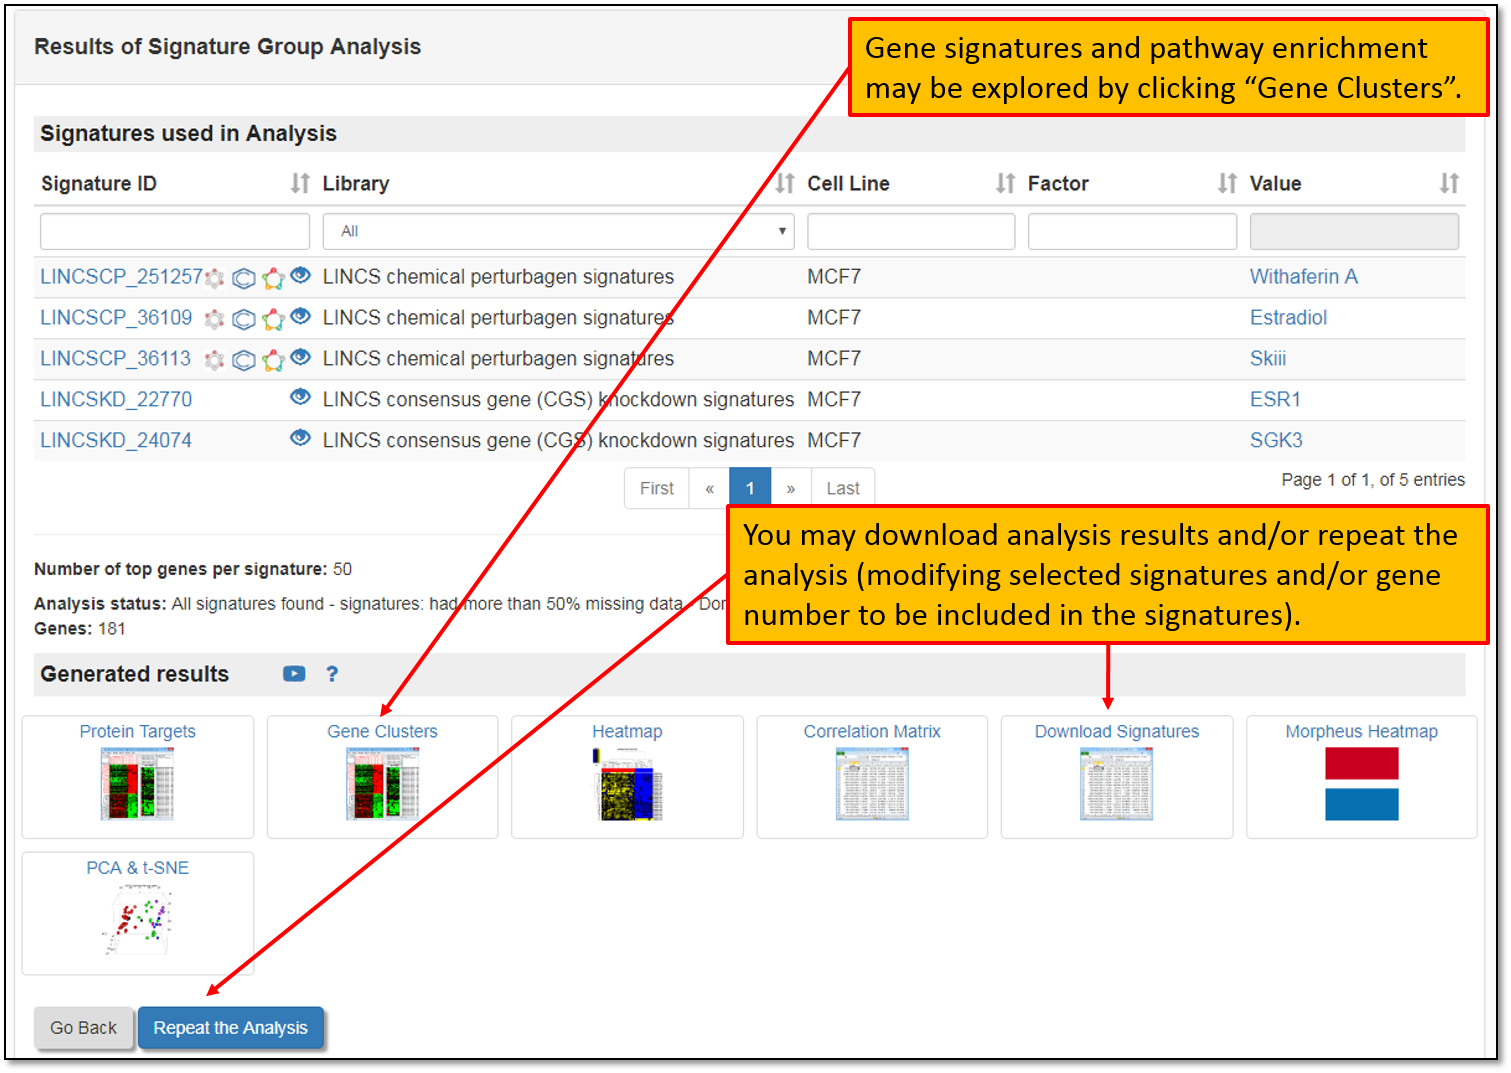
11. Clicking "Analyze 5 signatures", will perform signature group analysis and will display analysis results page for the signatures that we have selected earlier. Gene signatures and pathway enrichment can be explored by clicking "Gene Clusters". You may also download results for further analysis, and/or repeat the analysis by modifying selected signatures and/or gene number per signature to be included in the signature group analysis.
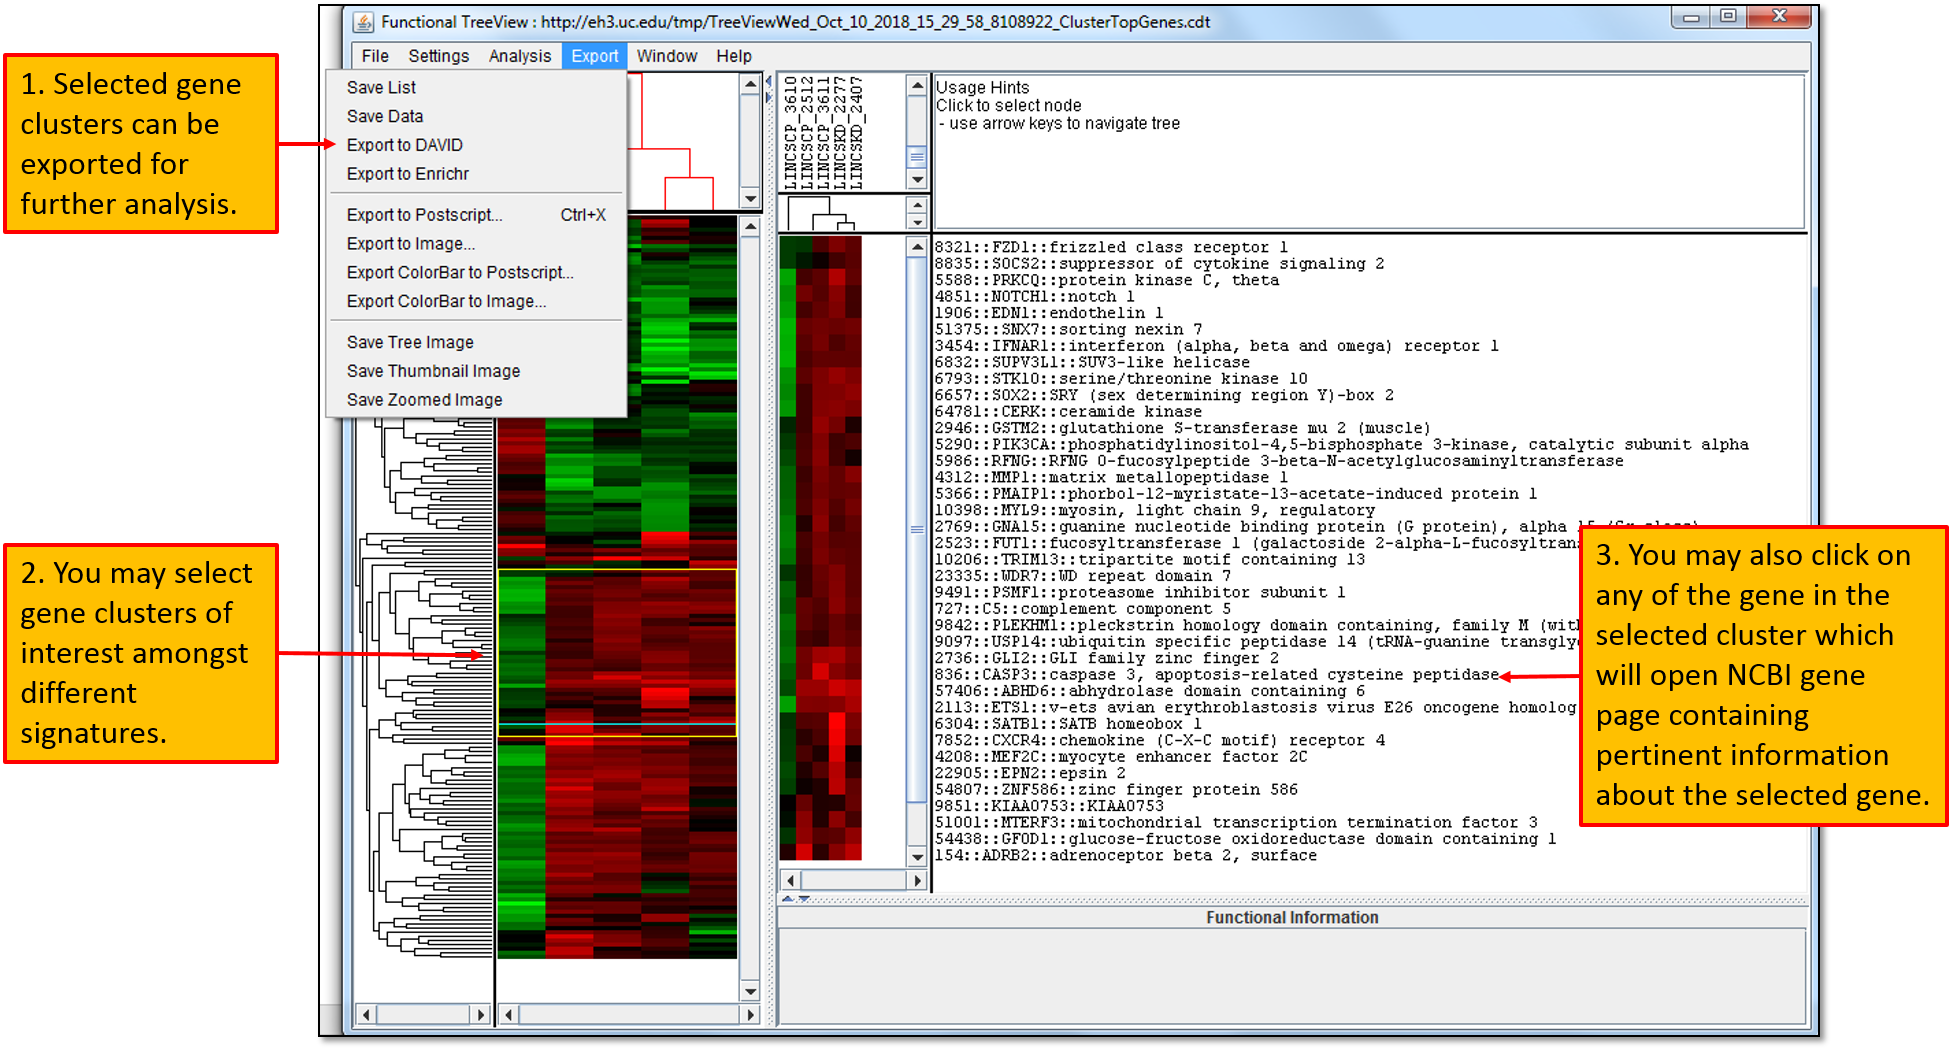
12. Clicking "Gene Clusters" will download a Functional Treeview analysis java file which will allow you to visualize similarly expressed gene clusters amongst selected signatures as shown in the figure below. Moreover, you may select gene clusters of interest, view genes in the cluster (you can also click on any of the gene in the cluster which will redirect you to NCBI gene page specific to the selected gene) and you may also export selected genes in the cluster for further analysis.